Case study · draft
A student project from the Rethinking.Logistics studio showing how tools deliver metrics for decisions.
| Student | Aycha Chambashala |
| Project | Community Integrated Logistics – Redefining Logistics Architecture as Urban and Ecological Infrastructure |
| Portfolio | heyzine.com/flip-book/22c36093a3.html |
| Studio | AD2 (Rethinking Logistics) |
| Year | 2026 |
| Location | Yunuseli, Osmangazi, Bursa, Türkiye (next to the former Yunuseli Airport, bordering a residential area) |
| Typology | urban logistics centre with storage/cross-dock and offices/control points, replacing an unstructured fabrication and open-storage site |
| Status | draft |
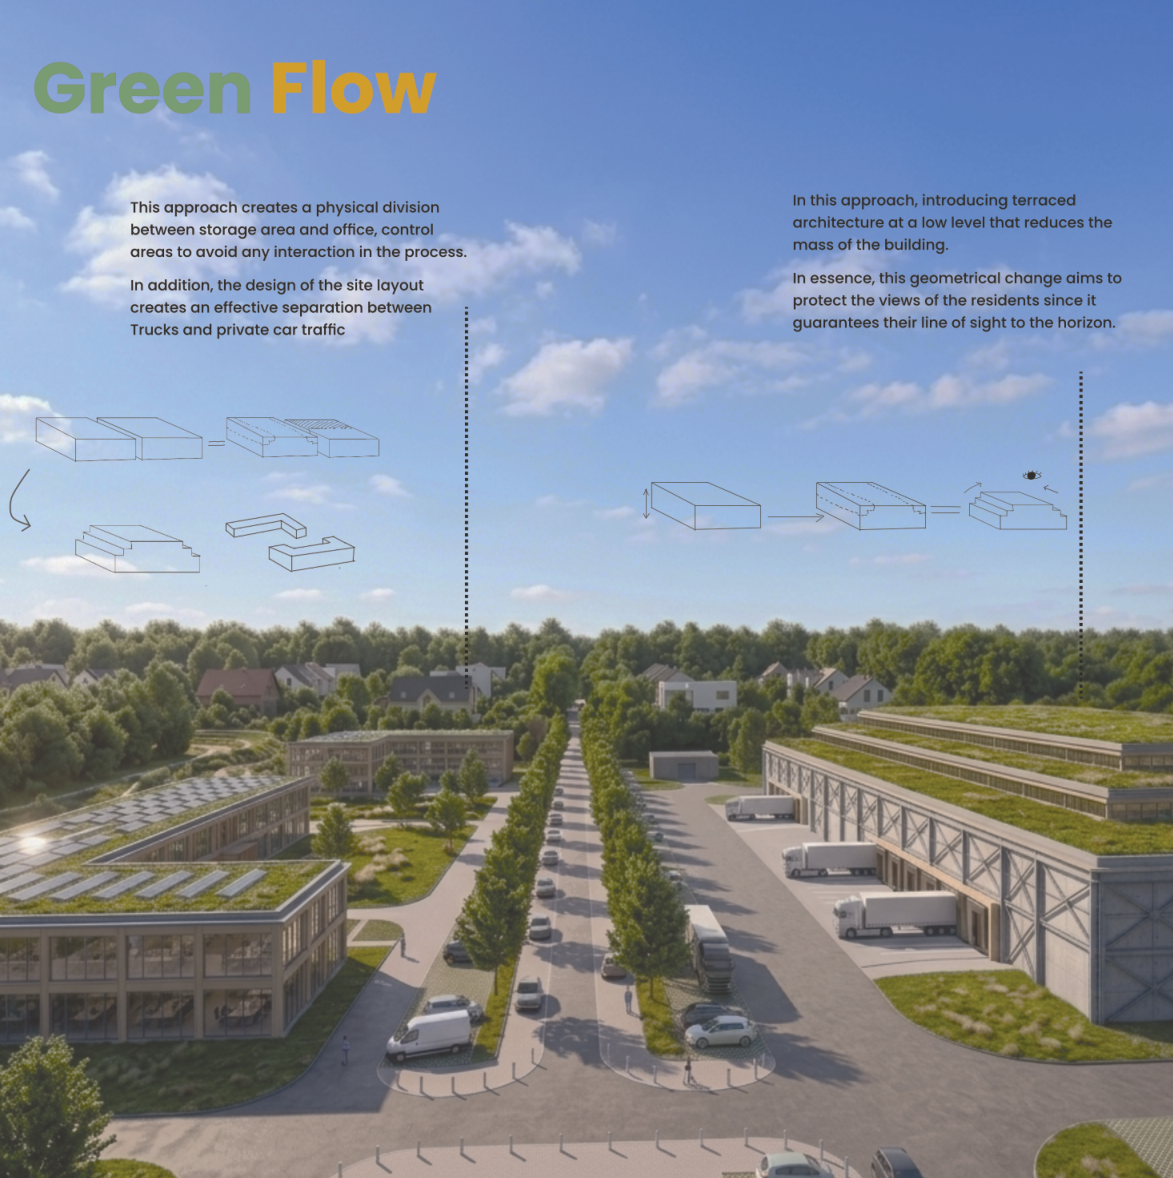
Project
The existing site is an industrial fabrication/storage area in Bursa that borders housing directly. It has no internal traffic system, one shared entrance for trucks and staff cars (so trucks queue on public roads), materials stored outdoors, no greenery or communal space, high heat-island exposure and uncontrolled stormwater. The concept ‘Community Integrated Logistics’ separates functions (storage/cross-dock vs offices/control) and traffic modes (trucks vs private cars) with an added entrance. Low terraced U- and L-shaped volumes with green roofs keep residents’ views, and tree-canopy streets, bioswales and dense native planting act as a noise, pollution and stormwater filter. Two massing alternatives (two large blocks; dispersed separate blocks) were compared and rejected in favour of the terraced U/L scheme.
How the student framed the challenge
- Urban integration of logistics buildings
- Truck flow and internal site circulation
- Stormwater runoff on large logistics sites
- Biodiversity on industrial sites
Metrics and evidence
Every metric the project used, as named by the student, with the value, the calculation and the portfolio page.
| Metric | Student’s wording | Value | How it was calculated | Tool | Page |
|---|---|---|---|---|---|
| Visual impact on neighbours | Residential Visual Preservation Index (RVPI) | No numbers; bar chart shows low baseline (buildings block views) rising to high in proposal (terraced roof); Alternative 1 scored low | Share of residents’ line of sight to the horizon kept free by the massing; calculation method not described. | not stated | 9, 10 |
| Truck throughput | Internal traffic circulation | No numbers; baseline shown as low (‘only one entrance, 0 efficiency’), proposal roughly half of scale with additional entrance and new internal traffic system; Alternative 2 scored low | Vehicle flow capacity of the on-site traffic system; method not described. | not stated | 9, 10 |
| Stormwater runoff reduction | Environmental Performance Improvement | No numbers; baseline near zero, proposal around mid-scale; Alternative 1 scored low | Composite improvement from stormwater systems, bioswales and green roofs; method not described. | not stated | 9, 10 |
| Native species richness | Biodiversity – species count, m² | No numbers; baseline near zero (‘no suitable place’), proposal high | Count of species supported per area based on varied vegetation; native species mapped (birds, hedgehogs, hares, pollinators; Oriental plane, linden, maple, Persian silk tree, acacia). | not stated | 9, 12 |
| Green area ratio | Vegetation – green area (m²) | No numbers; baseline near zero (‘lack of greenery’), proposal high (greenery all around the site) | Area of vegetated surfaces on the site. | not stated | 9 |
Tools
- One Click LCA — Described as the LCA tool for comparing structural systems (timber/steel/concrete) and certifications; no results shown, so actual use is not evidenced
Trade-offs
- Alternative 1 (two large blocks) gave clear visual and operational movement but scored low on residential view preservation and environmental performance (tunnel effect, ‘wall’ to neighbours).
- Alternative 2 (dispersed blocks) gave variety but lowered internal traffic circulation efficiency and created unused ‘dead zones’ between masses.
Decision
Comparing the two alternatives on RVPI, environmental performance and internal traffic circulation led to terraced U- and L-shaped volumes set back from the edges, with separate truck and car circulation and an added entrance.
Open questions
- No numerical KPI values; the bars are relative and the calculation methods are not stated.
- Could not answer energy (heating vs cooling, most energy-demanding functions), economy (CapEx/OpEx, electricity price, OpEx-reducing decision) or embodied vs operational carbon questions at mid-term.
- No LCA result despite the LCA section; KPI understanding and the evidence base still need study; not enough alternatives tested.
- Did not consider using the adjacent plot (consultation gap).
Connections
- Challenges addressed: Urban integration of logistics buildings, Truck flow and yard efficiency, Stormwater and sealed surfaces on logistics sites, Biodiversity and ecological connectivity on logistics sites
- Metrics used: Visual impact on neighbours, Truck throughput, Stormwater runoff reduction, Native species richness, Green area ratio, Function stacking index
Something wrong or missing? Suggest a correction