Case study · verified
A student project from the Rethinking.Logistics studio showing how tools deliver metrics for decisions.
| Student | Hynek Hrabík |
| Project | Flow-through logistics |
| Portfolio | scanned.page/n5qCOH |
| Studio | AD2 |
| Year | 2026 |
| Location | PPL central parcel hub, Hradec Králové, Czech Republic (as labelled in the portfolio; the questionnaire names PPL in Pardubice) |
| Typology | Parcel cross-dock / automated e-commerce sorting hub (hub-and-spoke network, PPL as DHL subsidiary) |
| Status | verified |
Project
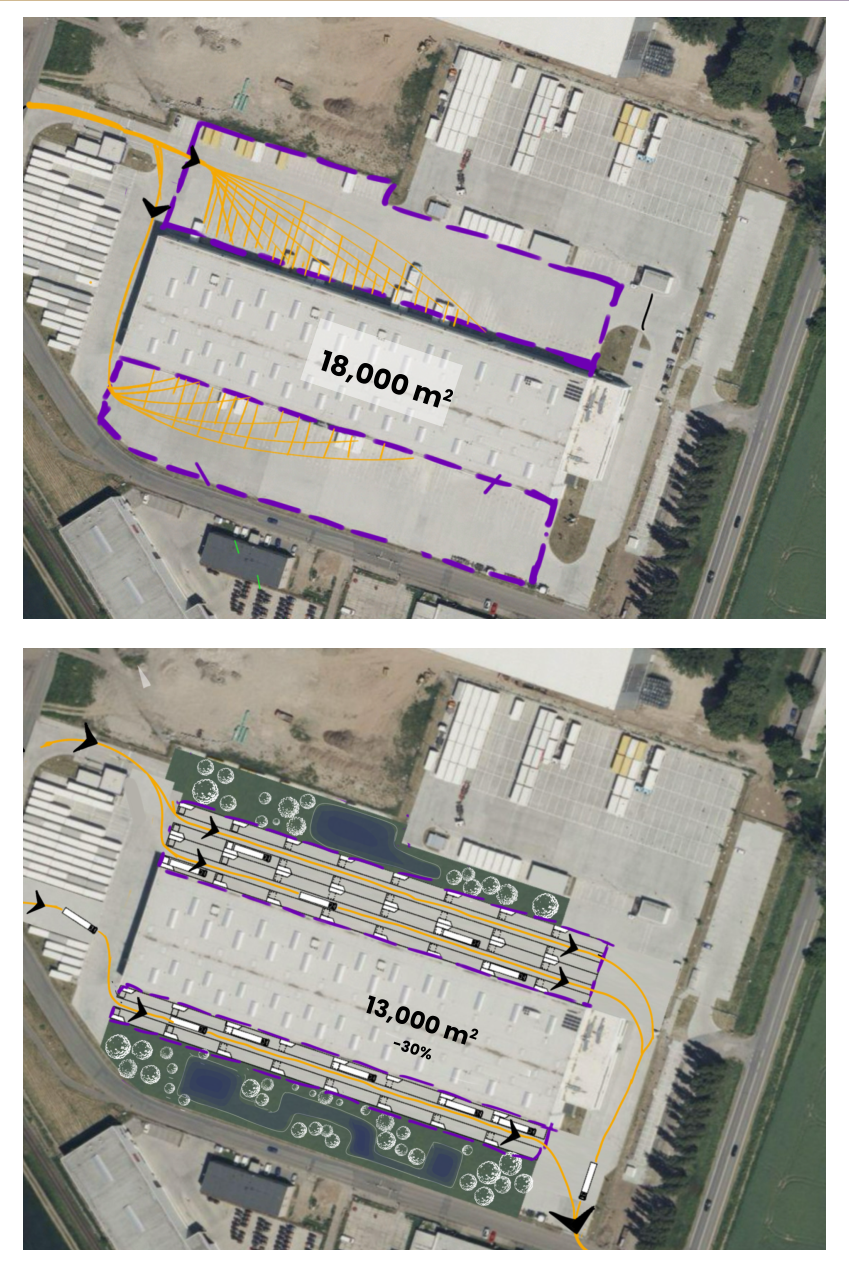
The project targets the truck manoeuvring apron of logistics hubs. A standard 16.5 m articulated truck needs about 30–40 m of clear apron depth, and these aprons take roughly 30–40% of total site area. The proposed flow-through configuration has trucks enter a corridor, switch lanes to line up with a bay, reverse briefly to dock and leave forward. Faster dock cycles let fewer docks handle the same throughput. Cargo moves between bays and the sorting hall through shallow underground tunnels (or overhead conveyors). Bay geometry was validated with swept-path analysis, which led to larger bays and a folding ramp. A discrete-event simulation showed that 40 flow-through docks match 60 conventional docks. The corridors are roofed with catenary concrete arches form-found in Rhino/Kangaroo, carrying metal roof panels with a sedum top. Applied to the PPL hub, the concept removes 20 docks and cuts paved surface by about 30%, from 18,000 to 13,000 m², freeing land for greenery and ponds.
How the student framed the challenge
- Truck manoeuvring area and paved land take
- Truck flow and yard efficiency
- Stormwater runoff from sealed logistics sites
- Biodiversity on paved logistics sites
Metrics and evidence
Every metric the project used, as named by the student, with the value, the calculation and the portfolio page.
| Metric | Student’s wording | Value | How it was calculated | Tool | Page |
|---|---|---|---|---|---|
| Yard area per dock | Maneuvers footprint: 30–40% of total area | 30–40% of total area (conventional layout) | Share of the site occupied by truck manoeuvring apron in conventional docking layouts (90° sight-side alley dock and 45° approach turn). | not stated | 3 |
| Yard area per dock | clear apron depth | 30–40 m (conventional) | Typical clear depth needed for a standard 16.5 m articulated truck to dock, plus lateral clearance for pull-past and trailer swept path. | not stated | 3 |
| Impervious surface ratio | decrease in paved (impervious) surface area | Existing 18,000 m² vs proposal 13,000 m² (−30% as stated) | Paved yard and apron area measured on aerial plans of the existing PPL hub and of the flow-through redesign with 20 fewer docks. | not stated | 11 |
| Number of docks | dock reduction | Simulation: classic layout 60 docks vs flow-through 40 docks at equal throughput. PPL case: assumed 70 docks (20 inbound : 50 outbound) cut by 20 | Minimum docks that maintain throughput, tested by discrete-event simulation. | Discrete-event simulation (custom; software not named) | 6, 10, 11 |
| Truck throughput | trucks handled | Classic 60 docks centred near 250; classic 40 docks bottlenecks, peaking around 245 with narrow spread; flow-through 40 docks centred near 250, overlapping the 60-dock case. PPL case: unchanged throughput at 300 trucks/hour | Discrete-event simulation with an average arrival rate of 250 trucks/hour and 2,000 runs per configuration; results shown as histograms of trucks handled. | Discrete-event simulation (custom; software not named) | 6, 11 |
| Yard area per dock | Geometric validation — swept path | Drawing dimensions include 27,200 and 19,485 mm lengths, and a bay cross-section of 2,140 / 3,665 / 4,730 / 3,665 / 2,140 = 16,340 mm, with 3,480 and 4,235 mm segments | Swept paths of standard trucks were generated to check bay width and length. Both were increased based on the results, and a folding ramp was added to keep bay length to a minimum. | AutoTURN | 5 |
| Yard area per dock | area/per dock; m² of asphalt per dock | Not reported in portfolio | Paved or asphalt area divided by number of docks, used to compare flow-through variants (done in Miro per questionnaire). | Miro (questionnaire) | questionnaire 3.2 / concept alternatives |
| Biodiversity net gain | biodiversity gain | Bar chart only, no numeric value | Percentage increase in ‘biodiversity units’ achieved through habitat creation or restoration versus the site baseline. | not stated | 12 |
| Biotope area factor | biotope area factor | Bar chart only, no numeric value | Share of the plot that functions ecologically, based on weighted surface categories. | not stated | 12 |
| Green plot ratio | green plot ratio | Bar chart only, no numeric value | Total leaf area of plants (via leaf area index, LAI) divided by site area. | not stated | 12 |
| Stormwater runoff reduction | runoff reduction ratio | Bar chart only, no numeric value | Percentage of stormwater retained on site compared with the pre-development reference state. | not stated | 12 |
| Impervious surface ratio | pervious surface gain | Bar chart only, no numeric value (related paved-area cut of 5,000 m² on p. 11) | Net increase in permeable surface area compared with the pre-development reference state. | not stated | 12 |
| Embodied carbon intensity | embodied carbon | Bar chart only, no numeric value | CO2 emitted in extraction, manufacture, transport and assembly of building materials; questionnaire notes most embodied carbon is in paved floors. | not stated | 12 |
| Operational carbon | operational carbon | Bar chart only, no numeric value | Estimated reduction in operational emissions compared with a conventional logistics facility of equivalent capacity. | not stated | 12 |
| Throughput per site area | land use efficiency (parcels/m² of site) | Bar chart only, no numeric value | Parcels processed per day per m² of occupied site or gross floor area. The definition mentions both bases. | not stated | 12 |
| Dock turnaround time | dock turnaround time | Bar chart only, no numeric value | Average time between a truck arriving at the facility gate and leaving the site, across all operational phases. | not stated | 12 |
| Visual impact on neighbours | Visual impact | Bar chart only, no numeric value | Percentage of the facility’s built perimeter screened from public viewpoints by vegetation, green buffers or landscape, compared with the pre-development reference. | not stated | 12 |
Tools
- AutoTURN — Swept-path analysis of standard trucks to validate and size docking bays and loading areas
- Kangaroo — Catenary (hanging-chain) form-finding of load-bearing roof arches under self-weight and roof-panel loads
- Discrete-event simulation (custom, software not named) — Testing throughput of classic vs flow-through layouts with 60/40 docks; 2,000 runs per configuration at 250 trucks/h
- Miro — Comparing flow-through variants by area per dock (questionnaire)
Trade-offs
- Adding conveyor belts and automation (needed for cargo continuity under the bays) raises energy consumption, conflicting with operational energy and carbon (questionnaire).
- CapEx rises for extra corridor structures and conveyor technology, possibly offset by less paved area and lower embodied carbon in floors (questionnaire).
- Removing docks cuts paved surface, but in a conventional layout it reduces throughput (40 classic docks bottleneck at about 245 vs about 250). Only the flow-through layout keeps throughput with fewer docks.
- Bays without buffer zones and visual guides demand more precise truck manoeuvring and reduce flexibility, an operational risk traded against footprint (questionnaire 4.4).
Decision
The simulation showed flow-through docking keeps full throughput with a third fewer docks, and the swept-path analysis fixed the bay size. Together they justified replacing conventional apron docking at the PPL hub with flow-through corridors: 20 fewer docks and about 30% less paved surface (18,000 to 13,000 m²), with the freed area turned into greenery and ponds.
Open questions
- Not enough alternatives tested, and no two concepts at opposite ends of the trade-off yet (questionnaire 6.2).
- Detailed traffic-engineering input pending; contacts obtained but no reply yet (questionnaire).
- Electricity price and CapEx/OpEx ratio not estimated (questionnaire).
- The environmental KPIs on p. 12 (biodiversity, BAF, green plot ratio, runoff, carbon, visual impact, turnaround time) are shown as bars with no numbers or method.
- Biodiversity and the structural design of long-span corridor roofs are named as needing outside experts (questionnaire C4).
Connections
- Challenges addressed: Truck flow and yard efficiency, Land take of logistics buildings, Stormwater and sealed surfaces on logistics sites
- Metrics used: Yard area per dock, Impervious surface ratio, Number of docks, Truck throughput, Biodiversity net gain, Biotope area factor, Green plot ratio, Stormwater runoff reduction, Embodied carbon intensity, Operational carbon, Throughput per site area, Dock turnaround time, Visual impact on neighbours
- Tools used: AutoTURN, Kangaroo, Grasshopper
Something wrong or missing? Suggest a correction