Case study · draft
A student project from the Rethinking.Logistics studio showing how tools deliver metrics for decisions.
| Student | Robin Jesenský |
| Project | Hybrid Cooling Data Center – Hybrid Air & Liquid Efficiency Cooling Structure (HALECS) |
| Portfolio | heyzine.com/flip-book/6872a7e156.html |
| Studio | ARCHIP Year 1 – Semester 2 (AD level not stated) |
| Year | 2026 |
| Location | Grindavík, Reykjanes peninsula, Iceland (wind data from Keflavík International Airport) |
| Typology | data centre (modular, passively wind-cooled) |
| Status | draft |
Project
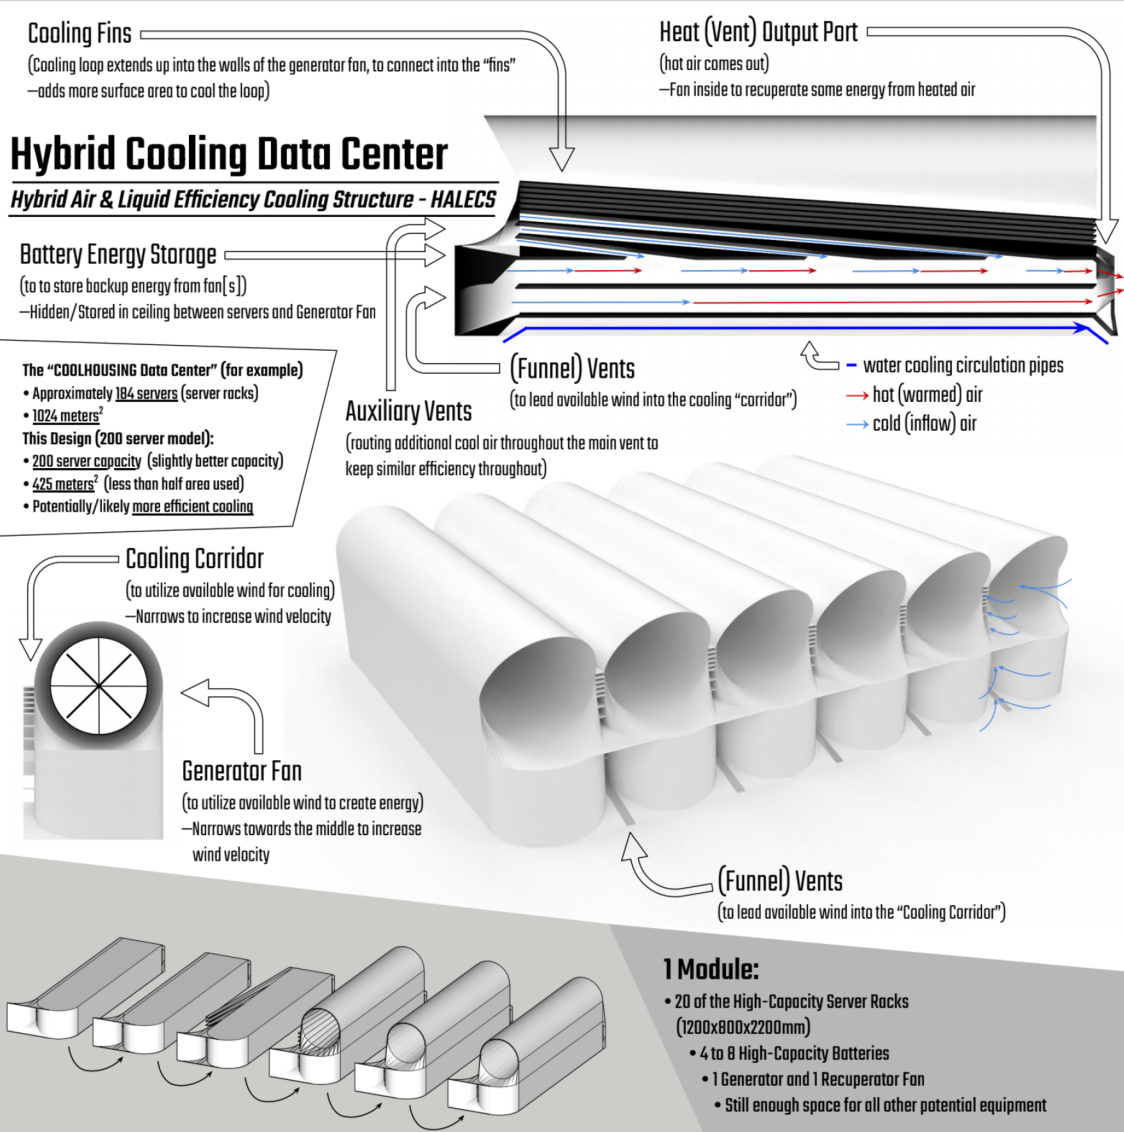
The project addresses data centres’ high water and electricity use for cooling and their poor use of space. It proposes HALECS, a row of six modular server halls (each 18.3 × 3.6 m, 6.1 m tall with fan and vents) whose curved copper shells, sloped ‘cooling fins’ and open intake vents channel prevailing ground wind through the servers, combined with an enclosed water-cooling loop per server that runs from floor to fins and could supply heat for residential water heating. Site selection was driven by wind speed, leading to a windy coastal location near Grindavík, Iceland, analysed with a Ladybug wind rose. The 200-server design occupies about 425 m², compared with an existing ~1,024 m² hosting data centre with about 184 racks, and material quantities and GWP figures are estimated for the copper shell and steel ribs.
How the student framed the challenge
- Water and energy use for data-centre cooling
- Space efficiency of data centres
- Wind-driven passive cooling of buildings
Metrics and evidence
Every metric the project used, as named by the student, with the value, the calculation and the portfolio page.
| Metric | Student’s wording | Value | How it was calculated | Tool | Page |
|---|---|---|---|---|---|
| Water consumption | Water Management – Liters / Time | Shown only as an unlabelled comparison bar; no numbers | Water used for cooling over a time period, compared to data centres of similar capacity. | not stated | 30 |
| Power usage effectiveness | Energy Efficiency – Processing / Watts | Shown only as an unlabelled comparison bar; no numbers | Average processing delivered per watt used; electricity saved versus other common cooling strategies of similar capacity. | not stated | 30 |
| Land take | Use of Space – % of area utilized | 192 m² server space of 422.73 m² total (≈45%); typical hosting data centres use 1/3–1/4 of building as server space (about 1/2 incl. hallways) | Area free of structure (or share of area used as server space) compared to average facilities of similar capacity. | manual / formula | 20, 30 |
| Land take | Data Center Comparison | Existing COOLHOUSING data centre ~1,024 m² for ~184 racks vs proposal ~425 m² for 200 servers (less than half the area) | Building area compared for similar server capacity against an existing hosting data centre (rack count estimated from typical spatial distribution). | manual / formula | 21, 22 |
| — | Self-sufficiency – Human Time Spent | Shown only as an unlabelled comparison bar; no numbers | Human time spent in or around the structure compared to structures of similar capacity. | not stated | 30 |
| Embodied carbon intensity | Copper GWP | 5 mm: 3,300 kg, GWP 9,500; 10 mm: 6,600 kg, GWP 19,000 (unit given as kg CO2 eq/m³) | Copper mass for the shell at 5 mm and 10 mm thickness multiplied by a GWP factor; figures rounded up. | not stated | 23 |
| Embodied carbon intensity | Structural Steel GWP | 414 m³; 541,650 kg if solid; GWP 373,000 (unit given as kg CO2 eq/m³, if solid) | Steel volume per rib (6.9 m³) × 10 ribs per module × 6 modules = 414 m³, converted to mass if solid and multiplied by a GWP factor. | not stated | 24 |
| Wind conditions | Location – wind speed map | ≈9.82 m/s marked on legend at 100 m height for the Grindavík area | Mean wind speed at the candidate site read from a wind resource map at 100 m height, used as the key site-selection criterion for passive cooling. | not stated (wind atlas map – visual inference) | 28 |
| Wind conditions | Ladybug LD Wind Rose | Speeds 0.5–27.3 m/s; calm 1.75% of time (153 h); dominant N/NNE and SSE directions | Annual hourly wind rose from TMYx weather file (Keflavík Intl. Airport) showing speed by direction and calm hours. | Ladybug (Grasshopper) | 29, 30 |
| — | Data Center Structure – battery packs | 4 packs, 13.6 m² each, 20–40 cm height | Plan area of four ceiling battery packs (400 × 340 cm) between roof fan and servers. | manual / formula | 25 |
Tools
- Ladybug — Wind rose of Keflavík TMYx weather file and a Grasshopper script measuring wind-rose polyline lengths
- Rhino — Wireframe section model V11 (visual inference from viewport style)
- SketchUp — Early model V1 sections and module plan (visual inference from viewport style; not named)
- Wind atlas web map — Site wind speed at 100 m height for site selection (visual inference; source not named)
Trade-offs
- Reducing cooling water use and cooling operating cost brings no biodiversity or ecological benefit to the site (questionnaire).
- A thicker copper shell (10 mm vs 5 mm) doubles copper mass and its embodied GWP, a choice the student lists without resolving.
- Wind speed drives site choice, but the windiest candidate sites were protected or hard to reach for heavy construction vehicles (questionnaire, location alternatives).
Decision
Wind data (wind atlas and Ladybug wind rose) supported siting the data centre on a windy, non-protected coastal location near Grindavík and orienting the modular shells to capture ground wind for passive air cooling; space comparison with an existing hosting data centre supported a compact 425 m² modular layout for 200 servers.
Open questions
- Cooling water, energy efficiency and self-sufficiency KPIs have no values; bars are illustrative only.
- No airflow/CFD simulation of the passive cooling; student names wind physics and advanced engineering as the missing knowledge (questionnaire 1.3).
- Economy, LCA, water runoff, biodiversity and location questions answered ‘I don’t know yet’ (questionnaire).
- Student reports needing to study the KPI evidence base and struggling with presentation (questionnaire 6.2).
- Location may change again because of access for heavy machinery (questionnaire).
Connections
- Challenges addressed: Waste heat and cooling of data centres, Outdoor microclimate around logistics buildings
- Metrics used: Water consumption, Power usage effectiveness, Land take, Embodied carbon intensity, Wind conditions
- Tools used: Ladybug, Grasshopper
Something wrong or missing? Suggest a correction