Case study · draft
A student project from the Rethinking.Logistics studio showing how tools deliver metrics for decisions.
| Student | Thomas Olsen |
| Project | The Reincarnation of Logistics – Adaptive Reuse for Urban Last-Mile Distribution |
| Portfolio | heyzine.com/flip-book/3fb738d9a8.html |
| Studio | AD2 |
| Year | 2026 |
| Location | Post-industrial district of Prague 9 (abandoned industrial building between railway and main tram street), Prague |
| Typology | urban last-mile logistics hub in an adaptively reused industrial building (truck inbound, EV outbound) with public plaza |
| Status | draft |
Also known as: Thomas Lund Olsen
Project
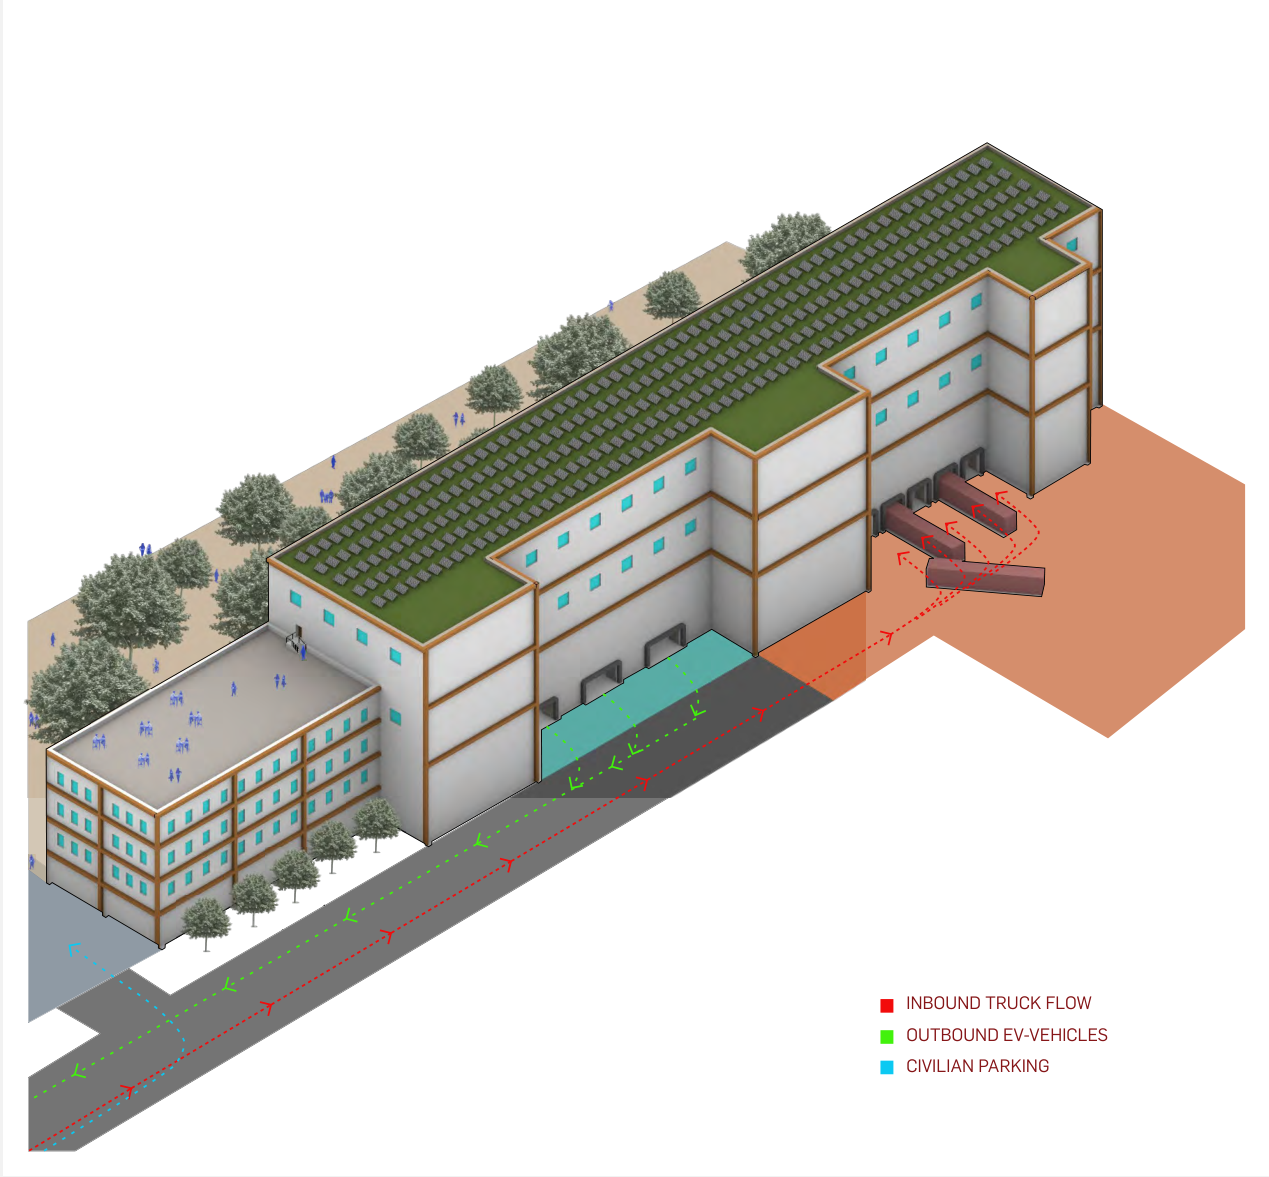
Growth of e-commerce pushes last-mile distribution closer to consumers, but dense cities lack space while many post-industrial buildings stand empty or are demolished. The project converts a long abandoned concrete-frame industrial building in Prague 9 into an urban logistics hub where trucks deliver to regional-scale docks and electric vans and bikes carry out last-mile delivery. A dual-sided layout puts the truck yard, docks and EV loading zone on one side and a landscaped public plaza with seating, greenery and water on the other, with offices at the head of the building. Storage occupies the upper floors and the roof becomes a biosolar roof combining PV panels and vegetation. KPIs compare the existing/conventional state with the proposal for delivery emissions, embodied carbon, roof use and public accessibility.
How the student framed the challenge
- Adaptive reuse to cut embodied carbon
- Last-mile delivery emissions in cities
- Public access to closed logistics sites
- Roof use for energy and biodiversity
Metrics and evidence
Every metric the project used, as named by the student, with the value, the calculation and the portfolio page.
| Metric | Student’s wording | Value | How it was calculated | Tool | Page |
|---|---|---|---|---|---|
| Last-mile delivery emissions | Delivery Emisson’s / EV-Vehicles | Combustion-engine fleet 350 tCO2/year vs. EV fleet 96 tCO2/year; KPI summary bar 100% → 28% | Annual CO2 of the delivery fleet with combustion-engine vehicles vs. electric vehicles; inputs (fleet size, km, emission factors) not shown. | not stated | 13, 14 (printed pp. 25, 27) |
| Embodied carbon saved by reuse | Embodied Carbon / Carbon Emission’s | Demolish + rebuild 1,566 tCO2e vs. renovation 450 tCO2e; KPI summary bar 100% → 39% | Simplified calculation: floor area × benchmark intensity, using approx. 250 kgCO2e/m² for renovation and approx. 650 kgCO2e/m² for demolition plus new construction. | manual / formula | 5, 13, 15 (printed pp. 9, 25, 29) |
| Green roof coverage | Roof Utilization / Roof usage | Before 5%; after 87% (KPI page) / 90% (biosolar roof page) | Share of roof area in active use (PV and vegetation of the biosolar roof) compared with the share used when the building was last active. | manual / formula | 13, 14 (printed pp. 25, 27) |
| Publicly accessible area | Public Accessibility / Public access | Before 3%; after 40% (KPI page) / 90% (public plaza page) | Share of the site that is publicly accessible (plaza, green space, pedestrian routes) before and after. | manual / formula | 13, 15 (printed pp. 25, 29) |
Tools
- Google Earth / Google Maps (probable) (probable — inferred from the graphics, not named) — Aerial and 3D site imagery and base for site-analysis overlays (buildings, green zones, transport, roads)
Trade-offs
- Maximising green roof area improves stormwater retention, biodiversity and thermal performance but reduces roof area for PV and therefore renewable energy production (green roof coverage vs. solar energy yield); resolved with a combined biosolar roof (questionnaire).
- Opening the site to the public and adding ecological features raises social value and biodiversity but may increase maintenance, wildlife disturbance and conflicts with logistics operations (public accessibility vs. operational efficiency) (questionnaire 4.4).
Decision
Keep and renovate the existing industrial structure instead of demolishing it, supported by the embodied carbon comparison (approx. 450 vs. 1,566 tCO2e). Organise the site dual-sided so trucks and EVs are separated from a new public plaza, and use the roof as a biosolar roof.
Open questions
- Lack of detailed baseline data: how much of each indicator existed before and how much actually changed (questionnaire 1.3).
- Truck space requirements and resulting pavement reduction still to be researched (questionnaire 1.5).
- KPI understanding and testing of alternatives named as biggest gaps (questionnaire 6.2).
- Inputs behind the delivery-emission figures and the floor area used for the embodied carbon calculation are not shown.
Connections
- Challenges addressed: Embodied carbon and adaptive reuse of logistics buildings, Last-mile delivery emissions and traffic, Public access and community use of logistics sites
- Metrics used: Last-mile delivery emissions, Embodied carbon saved by reuse, Green roof coverage, Publicly accessible area
Something wrong or missing? Suggest a correction