Case study · draft
A student project from the Rethinking.Logistics studio showing how tools deliver metrics for decisions.
| Student | Vladi Kostecki |
| Project | portfolio – AD2 | Rethinking Logistics (no separate project title given) |
| Portfolio | heyzine.com/flip-book/6aa82ff770.html |
| Studio | AD2 |
| Year | 2026 |
| Location | Brownfield / former industrial plant in the centre of Prague 9, between residential clusters and a green ecological corridor along the stream, Prague |
| Typology | mixed-use logistics hub in a reused industrial plant (logistics, storage, manufacturing and public commercial floors) with a new public park |
| Status | draft |
Project
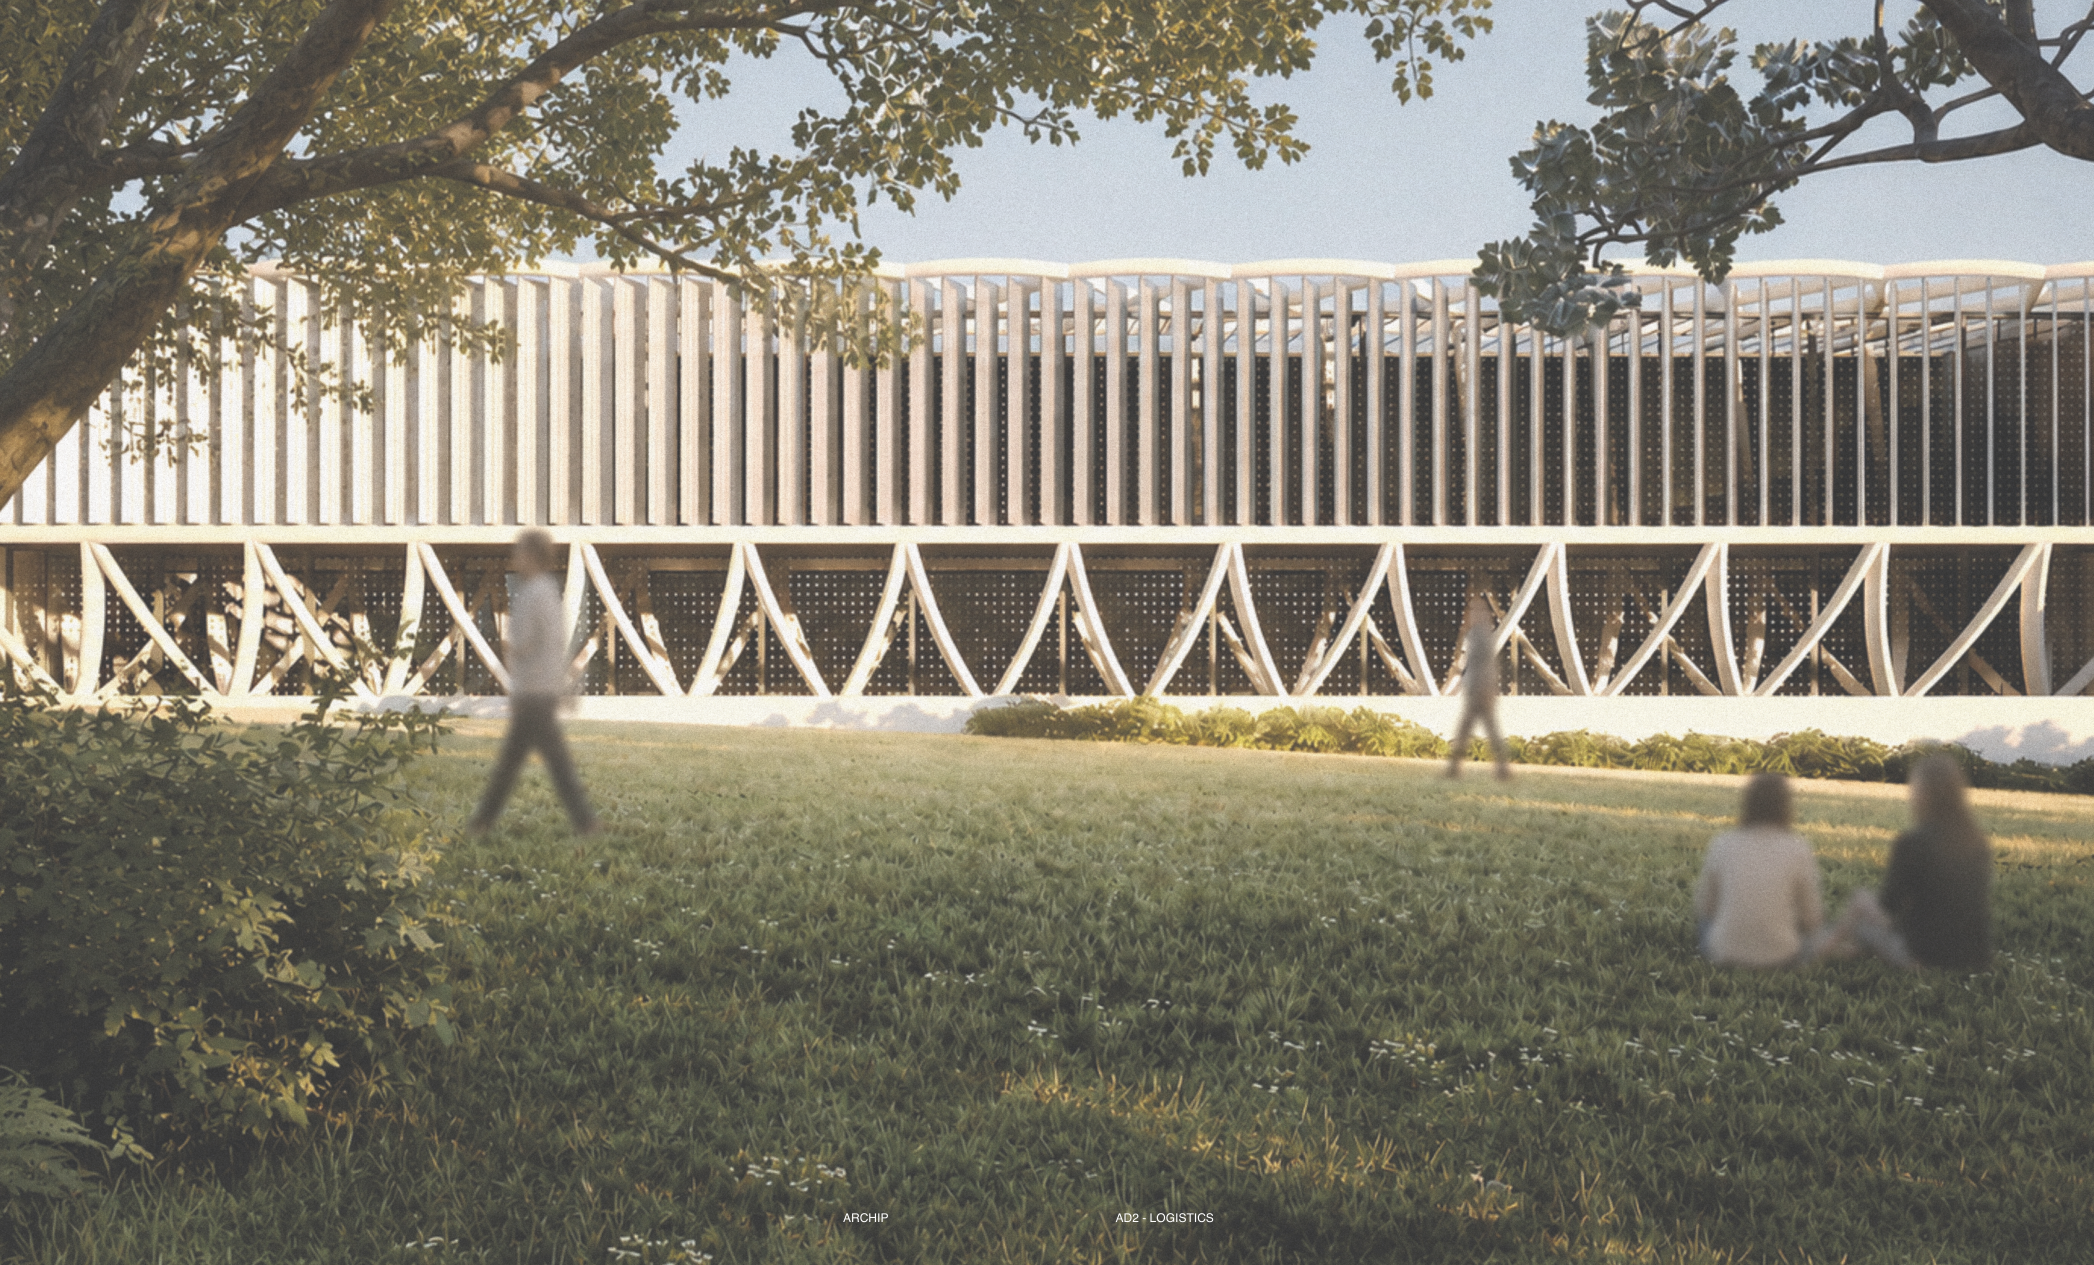
The site is a former three-building industrial plant on a Prague 9 brownfield, wedged between growing housing and a green corridor, where a conventional big-box warehouse would cut neighbourhoods off. The project keeps the existing structure and reorganises it into zones: logistics and loading docks with storage in the south-east, retained manufacturing in the north and a two-storey public commercial wing on the west carried by an expressive exoskeleton beam system and adaptive vertical façade panels. The adjoining brownfield becomes a 34,000 m² public park divided into four landscape zones from managed planting to dense habitat, and a pedestrian underpass separates residents from truck traffic. KPIs cover embodied and operational carbon (including carbon per pallet), monthly energy use before and after envelope renovation, pedestrian–truck intersections and green space.
How the student framed the challenge
- Adaptive reuse to cut embodied carbon
- Urban integration of logistics buildings
- Truck and pedestrian conflict on logistics sites
- Brownfield conversion into public green space
Metrics and evidence
Every metric the project used, as named by the student, with the value, the calculation and the portfolio page.
| Metric | Student’s wording | Value | How it was calculated | Tool | Page |
|---|---|---|---|---|---|
| Whole-life carbon | Annualized LCA / New Build vs Reconstruction | Reconstruction 232.4 tCO2e/year (162 operational + 70.4 embodied); new build 745 tCO2e/year (derivation not shown) | Operational CO2 per year plus embodied carbon divided by an assumed 30-year lifespan. | manual / formula | 9 (printed pp. 16–17) |
| Embodied carbon saved by reuse | Embodied Carbon | 2,112 tCO2e (approx. 70.4 tCO2e/year over 30 years); approx. 70% lower than new build | Warehouse area × retrofit benchmark: 6,400 m² × 330 kgCO2e/m²; reconstruction stated to save approx. 70% vs. comparable new build. | manual / formula | 9 (printed pp. 16–17) |
| Operational carbon | Building Operational Emissions | 162 tCO2/year | Annual electricity use × Czech grid emission factor: 30,000 kWh/month × 12 = 360,000 kWh/year × 0.45 kgCO2/kWh. | manual / formula | 9 (printed p. 17) |
| Carbon per pallet handled | Operational Carbon Intensity / Carbon Intensity Per Pallet | Operational only 1.01 kgCO2/pallet; operational + embodied 1.45 kgCO2/pallet | Annual emissions divided by pallets handled per year (160,000, from 25 pallets/m²/year × 6,400 m²). | manual / formula | 9 (printed p. 17) |
| Throughput per site area | Pallets Handled | 160,000 pallets/year | Assumed handling rate of approx. 25 pallets per m² per year × 6,400 m² warehouse area. | manual / formula | 9 (printed p. 17) |
| Energy use intensity | Energy efficiency – Current vs New Average Consumption | Original envelope 48,000 kWh/month vs. improved envelope 30,000 kWh/month, stated as approx. 37.5% annual reduction | Monthly energy demand split into heating, cooling, technology and lighting for the original and the improved (insulated, adaptive-façade) envelope; average monthly values compared. | not stated (monthly stacked energy chart, see notes) | 10 (printed pp. 18–19) |
| Pedestrian–vehicle conflict points | Original / New Traffic Intersections | Original 3; new 0 (pedestrian underpass and southern pedestrian route) | Number of points where residents’ walking routes cross logistics vehicle roads. | manual / formula | 11 (printed pp. 20–21) |
| Green area ratio | Original / New Green Space | Original 0 m²; new 34,000 m² | Area of new public green space (park in four landscape zones A–D) compared with the existing state. | manual / formula | 12 (printed pp. 22–23) |
Tools
- Unidentified energy simulation tool (probable — inferred from the graphics, not named) — Monthly stacked energy demand (heating, cooling, technology, lighting) for original vs. improved envelope
- Prague land-use / urban plan maps (IPR Praha geoportal, probable) (probable — inferred from the graphics, not named) — Land-use structure map of Prague and zoning overlay of the site
Trade-offs
- More green space on the property means less storage space (green space area vs. storage capacity) (questionnaire).
- Reuse with an upgraded envelope and adaptive façade raises upfront cost and embodied carbon of the renovation but lowers operational energy and running costs (CapEx/embodied carbon vs. operational energy) (questionnaire 4.4).
Decision
Retain and reconstruct the existing industrial structure rather than build new, supported by the annualised carbon comparison (approx. 232 vs. 745 tCO2e/year). Upgrade the envelope with insulation and sun-responsive façade panels (approx. 37.5% less energy), add a pedestrian underpass to remove all pedestrian–truck crossings, and turn the brownfield into a zoned public park.
Open questions
- The design does not yet account for future expansion if more land is purchased (questionnaire 1.2–1.3).
- No grey-water strategy yet; biodiversity measures are general (questionnaire).
- Questionnaire KPIs (truck turnaround time, queue time at bays, worker safety incidents/TRIR, dead space, truck flow-through rate) are not quantified in the portfolio.
- Concept clarity and testing of alternatives named as biggest gaps; alternatives for the green space vs. storage trade-off not yet developed (questionnaire 6.2).
Connections
- Challenges addressed: Embodied carbon and adaptive reuse of logistics buildings, Urban integration of logistics buildings, Pedestrian–truck safety on logistics sites, Truck flow and yard efficiency
- Metrics used: Whole-life carbon, Embodied carbon saved by reuse, Operational carbon, Carbon per pallet handled, Throughput per site area, Energy use intensity, Pedestrian–vehicle conflict points, Green area ratio
Something wrong or missing? Suggest a correction