Case study · verified
A student project from the Rethinking.Logistics studio showing how tools deliver metrics for decisions.
| Student | Johannes Berger |
| Project | Not titled; sections ‘The problem with trucks’, ‘Drones: the solution’ and ‘Old vs. new crossdock’ (research question in questionnaire: ‘What if there were no trucks?‘) |
| Portfolio | heyzine.com/flip-book/36c8679dd2.html |
| Studio | AD2 |
| Year | 2026 |
| Location | Not stated in portfolio; questionnaire names case studies DHL Poznań (Poland) and Tracker AS (Norway) |
| Typology | Drone-tailored cross-dock / vertical drone logistics warehouse (tower) |
| Status | verified |
Project
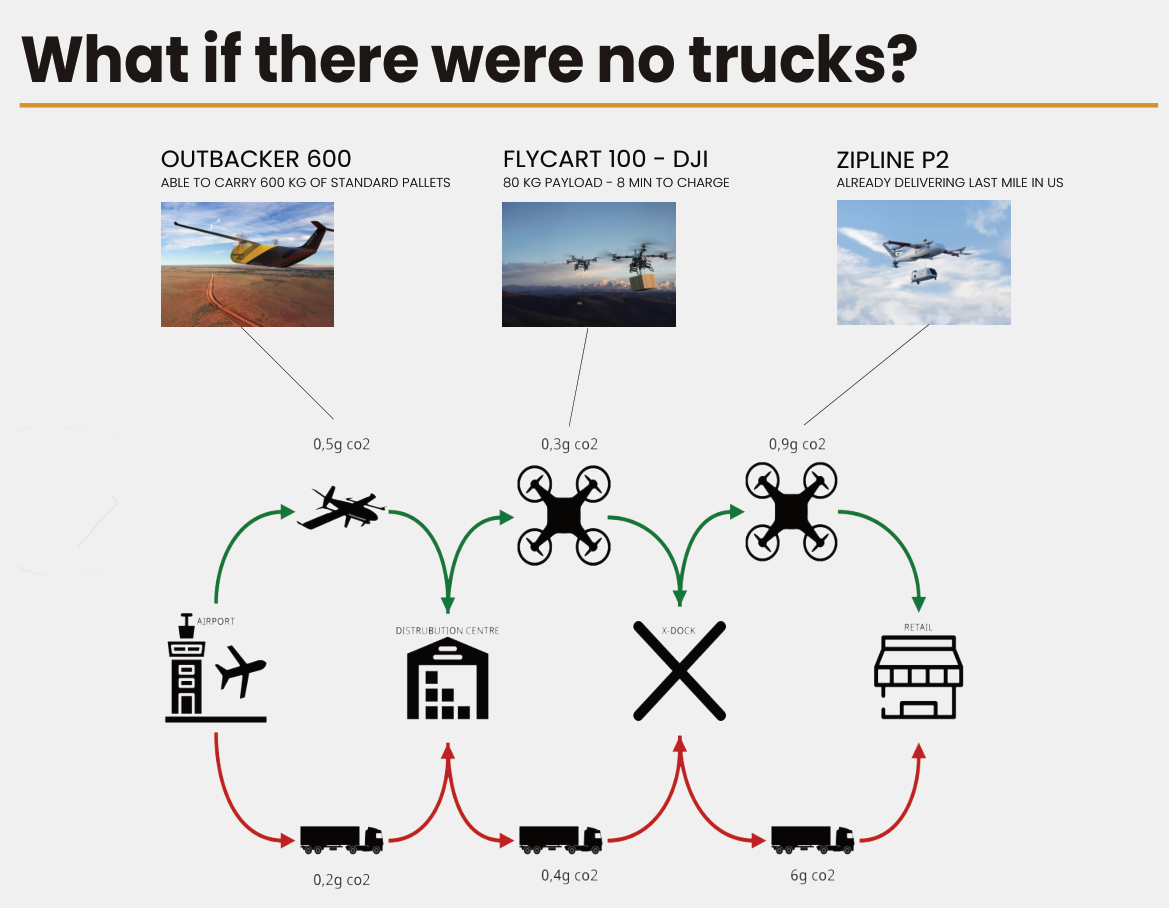
The project questions road freight dominance. Its case is that trucks carry a minority of global freight but emit most transport emissions, wear roads heavily, need drivers and fit badly in dense cities. It proposes replacing trucks with a drone-based supply chain in three phases. First, a traditional warehouse with truck delivery, the status quo. Second, a traditional warehouse with drone delivery, for faster, cheaper deliveries and less congested roads. Third, a drone-tailored, compact, cylindrical or vertical warehouse with drone delivery, for lower land use and lower building OpEx. The final spread compares massing of an existing low, sprawling cross-dock with a new cross-dock of two towers linked by a long elevated deck. The questionnaire adds plans for public space spiralling around the tower and an interest in reusing existing infrastructure.
How the student framed the challenge
- Truck dependency and road freight emissions
- Land take of warehouses
- Automation and delivery speed in supply chains
- Big-box typology lacking urban integration
Metrics and evidence
Every metric the project used, as named by the student, with the value, the calculation and the portfolio page.
| Metric | Student’s wording | Value | How it was calculated | Tool | Page |
|---|---|---|---|---|---|
| Road freight impact | trucks move 19% of global freight but cause 69% of global transport emissions | 19% of global freight vs 69% of global transport emissions | Literature statistic used to frame the problem; source not cited. | not stated | 3 |
| Road freight impact | One truck degrades the road as much as 15,000 cars | 1 truck ≈ 15,000 cars | Literature statistic (axle-load road wear); source not cited. | not stated | 3 |
| Energy per package delivered | Drones can have up to 94% lower energy consumption per package than other vehicles | Up to 94% lower for drones | Literature comparison of energy per delivered package for drones vs other vehicles; source not cited. | not stated | 4 |
| Last-mile delivery cost | last mile autonomous drones are already cheaper to deliver than trucks or a van | Drones cheaper (portfolio); ~90% last-mile saving (questionnaire) | Qualitative comparison of drone vs truck/van last-mile cost. The questionnaire estimates about 90% savings for last mile and similar cost earlier in the chain. | not stated | 4; questionnaire Economy 1 |
| Worker safety incidents | Zipline has had no major accident with 00,000+ deliveries | No major accident; the number of deliveries is incomplete in the portfolio (‘00,000+‘) | Operator statistic (Zipline) cited to argue drone safety. | not stated | 4 |
| Land take | Area usage / land use; ‘Lower land usage’ | Not quantified in portfolio; qualitative claim of lower land use (phase 3 and old vs new cross-dock massing) | Footprint and paved area of the existing cross-dock compared with the vertical drone cross-dock (proposed in questionnaire as easy to measure). | not stated | 4, 5; questionnaire 3.2 |
| Delivery time | Delivery time; ‘Faster deliveries’ | Not quantified; qualitative claim of faster deliveries in phase 2 | Time from dispatch to consumer, compared between truck-based and drone-based chains (method not described). | not stated | 4; questionnaire B3, 3.2 |
| Level of automation | Automation | Not quantified for the project; reference JD.com warehouse with 4 employees (questionnaire) | Number of staff needed for operation. The reference case cited from a lecture is a JD.com warehouse run by 4 employees. | not stated | questionnaire 3.2 |
Tools
No digital tool is named in the portfolio — values were estimated by hand, taken from literature, or not quantified.
Trade-offs
- Increasing warehouse height reduces area footprint (land use) but increases embodied carbon and CapEx (questionnaire; student says both extremes are developed).
- A drone network needs very high upfront CapEx for new infrastructure but promises lower OpEx, especially for last-mile delivery (questionnaire Economy 1).
- Building vertically lowers land use but raises operational energy cost (questionnaire Energy 2).
Decision
The cited evidence on truck emissions, drone energy per package and last-mile cost supports a phased switch to drone delivery. It ends in a drone-tailored vertical cross-dock (two towers with an elevated deck) that replaces the low, sprawling truck cross-dock to cut land use and building OpEx.
Open questions
- Mid-term feedback said the KPIs were too vague and hard to measure. The student also found he could not defend his carbon calculations in detail (questionnaire 1.2/1.3).
- CapEx/OpEx ratio not estimated because concepts were not consolidated (questionnaire).
- No grey-water analysis; native species and unintended consequences ‘tbd’ (questionnaire).
- The portfolio gives no project-specific values for land use, delivery time, automation or carbon. All figures are cited literature statistics.
Connections
- Challenges addressed: Last-mile delivery emissions and traffic, Land take of logistics buildings, Automation and operational efficiency of logistics
- Metrics used: Road freight impact, Energy per package delivered, Last-mile delivery cost, Worker safety incidents, Land take, Delivery time, Level of automation
Something wrong or missing? Suggest a correction