Case study · draft
A student project from the Rethinking.Logistics studio showing how tools deliver metrics for decisions.
| Student | Marek Nový |
| Project | Visible Industry |
| Portfolio | heyzine.com/flip-book/480d6152b8.html |
| Studio | AD2 |
| Year | 2026 |
| Location | Otovice, Karlovy Vary, Czech Republic (field between the village centre, existing industrial halls and ponds) |
| Typology | mixed industrial–logistics district: large warehouses, medium workshops and small shops/cafés along a public ‘productive promenade’ |
| Status | draft |
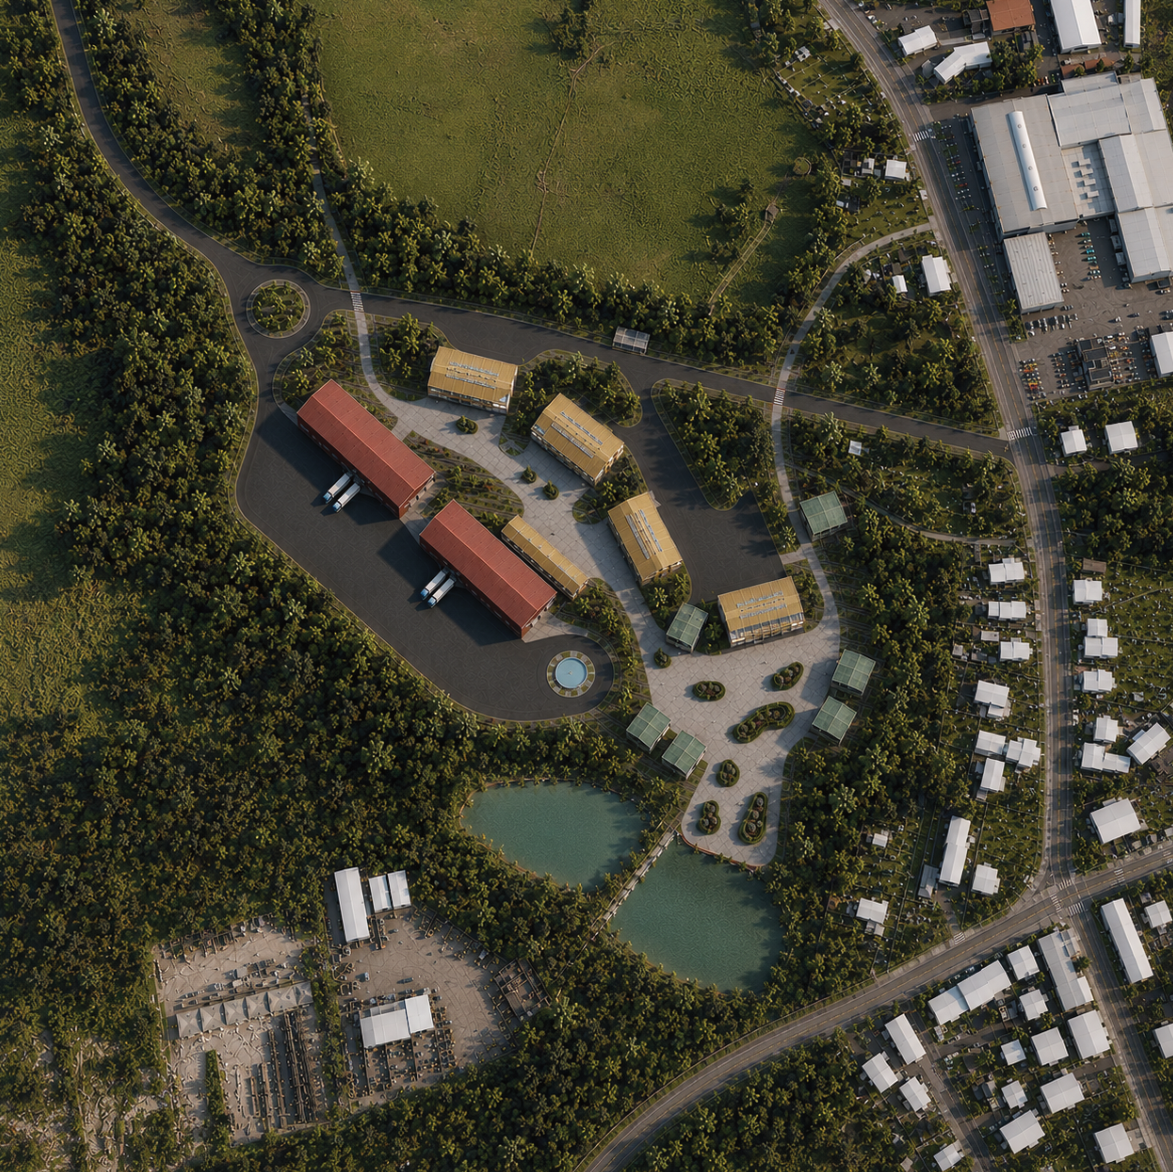
Project
Otovice mixes housing, industry, municipal services and manufacturing, but it has few places where people stay; most visitors leave once their errand is done. The ‘Visible Industry’ concept puts warehouses, workshops, studios, cafés and retail into one connected structure on an open field, showing production through transparent façades and public routes instead of hiding it. The site steps in scale from warehouse-oriented (two large red warehouses with truck yard) through workshop-oriented to community-oriented zones with small shops, all linked by a productive promenade. Landscape works as infrastructure: tree belts as filter and buffer to housing, retention ponds, permeable surfaces and green islands for shade and public space.
How the student framed the challenge
- Urban integration of logistics buildings
- Stormwater runoff on large logistics sites
- Public life and social value of industrial sites
- On-site renewable energy for logistics
Metrics and evidence
Every metric the project used, as named by the student, with the value, the calculation and the portfolio page.
| Metric | Student’s wording | Value | How it was calculated | Tool | Page |
|---|---|---|---|---|---|
| Tree count and canopy cover | Net Tree Gain | Existing 46 → proposed 257 trees | Count of trees on site in existing state vs proposal. | manual / formula | 17 |
| Sun exposure of outdoor space | Shaded Public Space Coverage | Existing 8% → proposed 23% | Shaded area of public space divided by total public space area. | not stated | 17 |
| Noise level | Noise Exposure Reduction | 6–12 dB reduction | Estimated reduction in noise at receptors from tree belts and buffers between industry and housing; method not stated. | not stated | 17 |
| Biodiversity net gain | Biodiversity Index | Existing 15% → proposed 37% | Index of ecological value of site surfaces; method not stated. | not stated | 17 |
| Stormwater retention volume | Retention Capacity | Existing 0 → proposed 855 m³ | Storage volume of retention ponds and retention elements on site. | not stated | 15, 17 |
| Water reuse share | Rainwater Reuse Potential | 25–40% reduction of potable water | Share of potable water demand that harvested rainwater could replace. | not stated | 17 |
| Social interaction index | Public Seating Density | Existing 5% → proposed 32% | Share of public space equipped with seating; method not stated. | not stated | 17 |
| Visual impact on neighbours | Visual Transparency Index | Existing 0 → proposed 386 m² | Area of transparent façade through which production is visible from public routes. | not stated | 13, 17 |
| Sun exposure of outdoor space | Solar Exposure | Existing 92% → proposed 77% | Share of site/public area receiving direct sun; method not stated. | not stated | 17 |
| Rooftop PV generation | Solar Panel Energy Production | Existing 0 → proposed 180–320 MWh/year | Annual electricity yield of roof-mounted PV; method not stated. | not stated | 17 |
| Space utilisation | storage/manufacturing areas (m²) | Empty hall 4,257 m²; glass storage 1,450 m²; window storage 1,965 m²; further storage 725 m² | Area take-off of existing halls to relocate manufacturing and storage (glass storage, window storage, empty hall). | manual / formula | 21 |
Tools
- AI image generator (unnamed) (probable — inferred from the graphics, not named) — Generating concept variants (Silent Factory, Public Industry, Productive Landscape, Adaptive Framework) from an input massing image – visual inference
Trade-offs
- Implied by the KPI table, not discussed by the student: solar exposure falls from 92% to 77% as tree count (46 → 257) and shaded public space (8% → 23%) rise, so more shade and canopy cost sun access (and possibly PV/daylight potential).
Decision
The KPI comparison was used to justify the layered layout (warehouse, workshop and community zones), tree buffers towards housing, retention ponds and permeable surfaces, and transparent production façades along the promenade. No variant-level comparison is shown, so the evidence supports the scheme as a whole rather than a specific choice.
Open questions
- Calculation methods and tools behind all KPI values are not documented.
- KPIs from the questionnaire (A–B travel distance storage → manufacturing, daylight autonomy in manufacturing areas, reserved expansion area, truck circulation time, pedestrian–logistics crossing points) are not quantified in the portfolio.
- Topic felt less clear than at the start of the semester and the student’s role (water management) was unclear (questionnaire B5).
- No embodied carbon / LCA or operational energy demand, although carbon minimisation was part of the initial research question.
Connections
- Challenges addressed: Urban integration of logistics buildings, Stormwater and sealed surfaces on logistics sites, Public access and community use of logistics sites, Operational energy and on-site renewables
- Metrics used: Tree count and canopy cover, Sun exposure of outdoor space, Noise level, Biodiversity net gain, Stormwater retention volume, Water reuse share, Social interaction index, Visual impact on neighbours, Rooftop PV generation, Space utilisation, Green-core anchoring of mixed uses
Something wrong or missing? Suggest a correction