Case study · draft
A student project from the Rethinking.Logistics studio showing how tools deliver metrics for decisions.
| Student | Sara Gani |
| Project | Infrastructure as Landscape, Where Logistics Meets Life (portfolio itself is titled only ‘Portfolio’) |
| Portfolio | heyzine.com/flip-book/056b2f6905.html |
| Studio | AD2 |
| Year | 2026 |
| Location | Pivoňská, Praha 14 (Černý Most area), Prague; case-study site: Wakestone Logistics, Tuchoměřice–Středokluky near Prague Airport / R7 |
| Typology | storage and distribution warehouse (pallet / high-bay storage) with offices, café/shop and public park, relocated next to a residential area |
| Status | draft |
Project
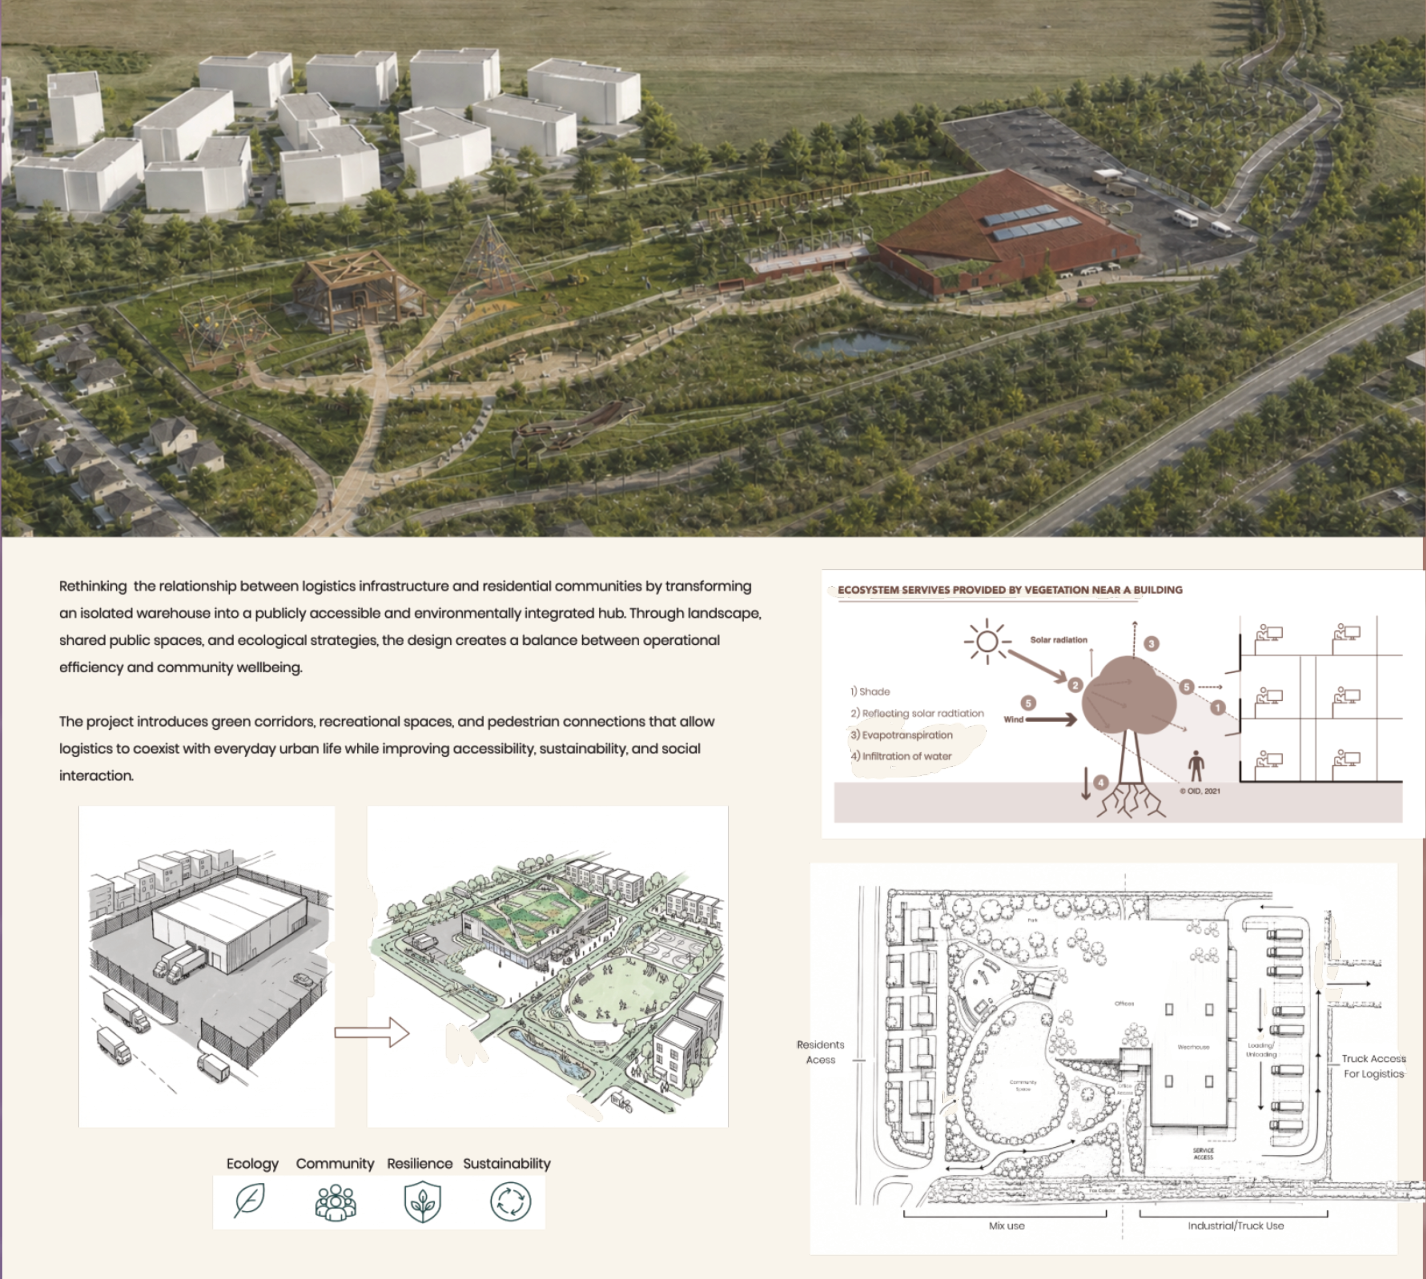
The project starts from an existing isolated warehouse near Prague Airport (Wakestone Logistics, approx. 5,500 m² in two halls plus 3,000 m² offices), where trucks and cars share routes and offices sit deep inside the hall without daylight. A first proposal in the existing context reorganises it into an L-shaped building that separates offices, control rooms and a restaurant from high-bay storage and docks, with distinct truck, car and pedestrian routes and a green buffer. The scheme is then moved to Pivoňská, Prague 14, between a residential area and rail/road infrastructure, where the warehouse is partly buried under a green roof that ramps down into a public park, community space, retention pond and a fox corridor along the rail line. Truck access and loading are placed on the far side from the housing, and three layout variants (L-shape, two separate buildings, campus) were compared with a KPI slider matrix.
How the student framed the challenge
- Urban integration of logistics buildings
- Truck, car and pedestrian flow separation
- Worker comfort and daylight in warehouses
- Biodiversity and ecological connectivity on logistics sites
Metrics and evidence
Every metric the project used, as named by the student, with the value, the calculation and the portfolio page.
| Metric | Student’s wording | Value | How it was calculated | Tool | Page |
|---|---|---|---|---|---|
| Publicly accessible area | Pedestrain access (m²/year) | Current 450 m²; proposal 2,400 m² | Area of the site usable by pedestrians/public, existing vs. proposal; method of measurement not described. | not stated | 31 |
| Embodied carbon intensity | Embodied Carbon (kgCO₂e/kg) | Current materials 800; proposed materials 520 | Embodied carbon of current vs. proposed material choices; calculation basis not described. | not stated | 31 |
| Biodiversity net gain | Biodiversity Gain (%) | Current 5%; proposed 45% | Share of the site providing habitat / green cover, current vs. proposed environment; method not described. | not stated | 31 |
| Energy use intensity | Energy use per m² / EUI | Before 220–280 kWh/m²a; after 110–160 kWh/m²a. Monthly chart: peak January approx. 107 MWh before vs. approx. 79 MWh after (read from chart). | Total annual building energy (heating, cooling, technology, lighting) divided by floor area; monthly energy demand modelled for before and after states. | not stated (monthly stacked energy chart, tool not named) | 29, 31 |
| Water reuse share | Water managment (% water reuse) | Before 20–30%; after 70–90% | Share of water reused on site, before vs. after; method not described. | not stated | 31 |
| Pedestrian–vehicle conflict points | Traffic sepration (%) / Traffic Separation Index | Before 30%; after 90% | Share of truck, car and pedestrian routes that are physically separated from each other (questionnaire: calculated in percent). | manual / formula | 31, 35 |
| Daylight autonomy | Daylight comfort (%) / Daylight access (% of spaces) | Before 35%; after 70–85% | Share of occupied spaces (offices, staff areas) with adequate natural light; method not described. | not stated | 31, 35 |
| Space utilisation | Space Utilization | Qualitative slider comparison of three layout variants (L-shape, two buildings, campus); no numbers given | Share of floor area and volume effectively used for storage and operations (questionnaire: calculated in percent). | manual / formula | 35 |
| Publicly accessible area | Accessible Green Space | Qualitative slider comparison of three variants; no numbers given | Publicly accessible green area divided by site area. | not stated | 35 |
| Noise level | Noise exposure | Qualitative slider comparison of three variants; no numbers given | Noise level in human working zones and towards residents. | not stated | 35 |
| Parking capacity | Parking Usage | Qualitative slider comparison of three variants; no numbers given | Share of parking spaces used. | not stated | 35 |
| Natural ventilation potential | Natural Ventilation | Qualitative slider comparison of three variants; no numbers given | Airflow and cross-ventilation enabled by the building form. | not stated | 35 |
| Worker safety incidents | Worker Safety Incidents | Qualitative slider comparison of three variants; no numbers given | Number of safety incidents in operational areas per year (would require operational data). | not stated | 35 |
| Operational carbon | CO2 Emissions - carbon | Qualitative slider comparison of three variants; no numbers given | Annual CO2 emissions of each layout variant. | not stated | 35 |
| Space utilisation | Storage Capacity | Qualitative slider comparison; campus variant noted as having lower storage and being less efficient for trucks | Relative storage capacity of each layout variant. | not stated | 35 |
| Life-cycle impact by stage | LCA – Results by life-cycle stage | A1–A3 materials dominate (approx. 40–85% depending on indicator, GWP approx. 70%); B4–B5 replacement second (up to approx. 37%); transport, construction and end-of-life each below approx. 10% | Building LCA split by life-cycle module; shares of each impact category per stage. | not stated (web LCA tool export, see notes) | 33 |
Tools
- One Click LCA (probable — inferred from the graphics, not named) — LCA chart ‘Results by life-cycle stage’ with EN 15978 modules and multiple impact indicators
- Unidentified energy simulation tool (probable — inferred from the graphics, not named) — Monthly stacked energy demand (heating, cooling, technology, lighting) before and after
- OID Bat-ADAPT / R4RE (probable) (probable — inferred from the graphics, not named) — Climate-hazard exposure × vulnerability scheme and list of green-infrastructure adaptation measures
- Google Maps / Google Earth (probable) (probable — inferred from the graphics, not named) — Aerial site imagery and 3D context for case study and new site
Trade-offs
- More windows and open areas raise daylight comfort for workers but take wall space from shelving, reducing storage capacity (daylight comfort vs. storage capacity).
- Splitting the programme into two separate buildings improved traffic separation but used too much site area and isolated workers (traffic separation vs. space utilisation / worker cohesion).
- The campus layout gave more public space for residents but lowered storage and was inefficient for truck circulation (accessible green/public space vs. storage capacity and logistics efficiency).
Decision
The L-shaped layout that groups offices, control rooms and café/shop in one wing and storage/docks in the other was kept because it scored best across the KPI matrix while separating truck, car and pedestrian flows. Relocating next to housing led to placing truck access and loading on the side away from residents, with a green-roofed, partly buried building, public park and fox corridor towards the neighbourhood.
Open questions
- How much truck noise and traffic still affect the residential area after placing them on the far side (questionnaire 1.3).
- Stormwater runoff reduction and grey-water strategy not yet answered; CapEx/OpEx and LCA improvements marked ‘to get back to’ (questionnaire).
- Wider biodiversity connections and support for native species still to be developed.
- Concept clarity and presentation named as biggest gaps (questionnaire 6.2).
- KPI values on p.31 are given without stated calculation method or tool; appendix KPI sliders have no numeric values.
Connections
- Challenges addressed: Urban integration of logistics buildings, Pedestrian–truck safety on logistics sites, Worker comfort and well-being, Biodiversity and ecological connectivity on logistics sites
- Metrics used: Publicly accessible area, Embodied carbon intensity, Biodiversity net gain, Energy use intensity, Water reuse share, Pedestrian–vehicle conflict points, Daylight autonomy, Space utilisation, Noise level, Parking capacity, Natural ventilation potential, Worker safety incidents, Operational carbon, Life-cycle impact by stage, Green-core anchoring of mixed uses
Something wrong or missing? Suggest a correction