Case study · verified
A student project from the Rethinking.Logistics studio showing how tools deliver metrics for decisions.
| Student | Sara Sulollari |
| Project | Wind Rós |
| Portfolio | heyzine.com/flip-book/a7dde90411.html |
| Studio | AD4 |
| Year | 2026 |
| Location | Eimskip site, Sundabakki 2, Sundahöfn harbour, Reykjavík, Iceland |
| Typology | port logistics building (container terminal warehouse) adapted with courtyard extension and a wind-buffer wall of reused shipping containers |
| Status | verified |
Project
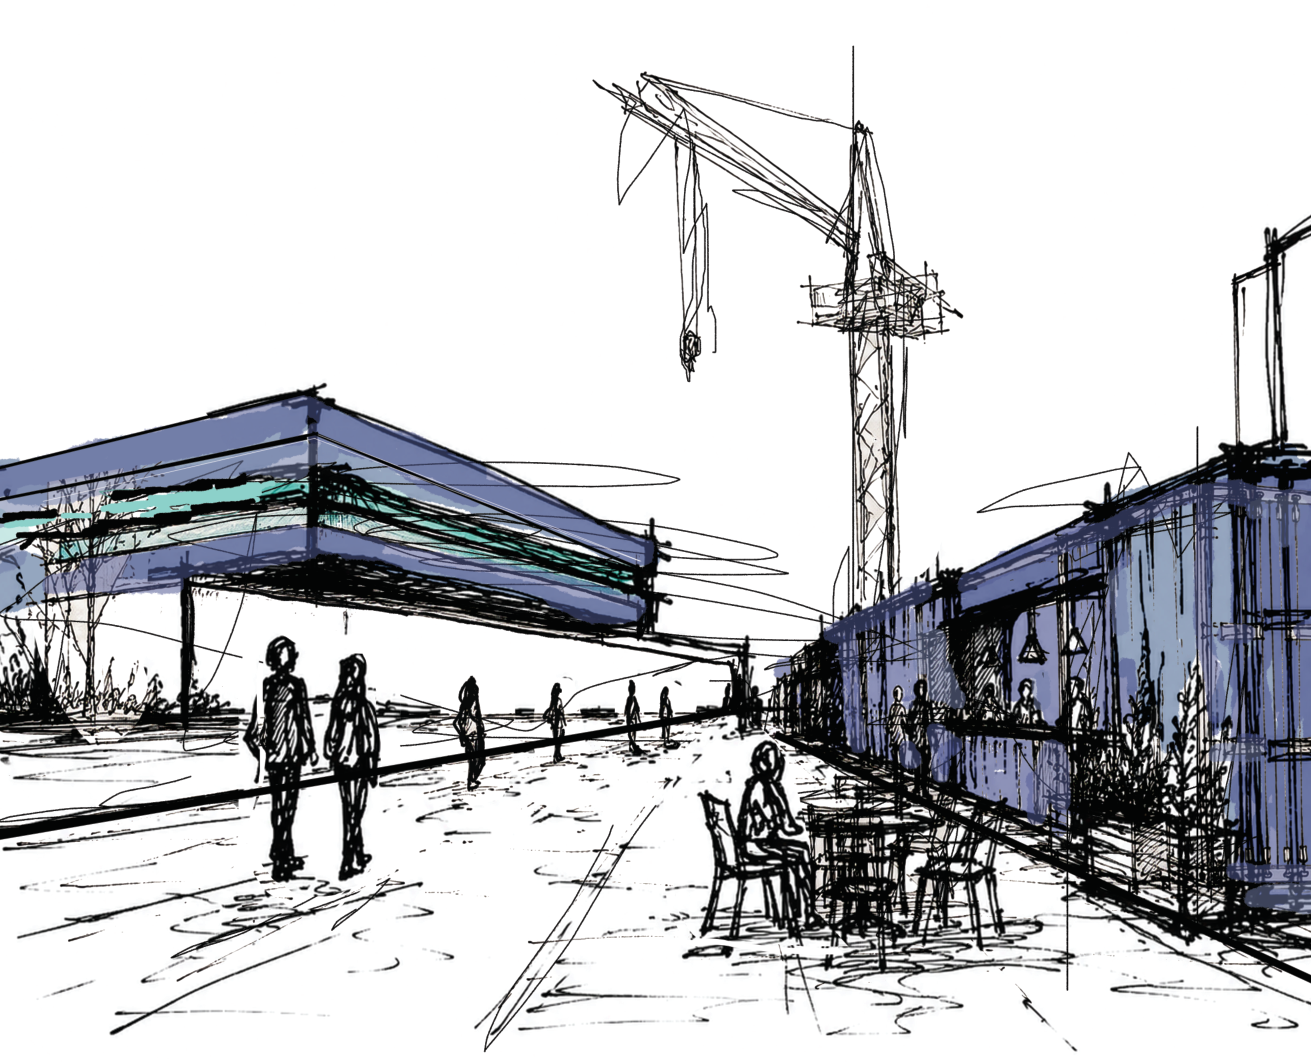
The Eimskip harbour site in Reykjavík is a closed industrial waterfront where strong sea winds, truck traffic along the quay and large buildings make the area uncomfortable and cut it off from the city; Iceland also has no rules on pedestrian-level wind comfort. Using local wind data, the student compares container layouts (linear, softened corner, U-shape) in wind simulations and chooses a U-shaped wall of reused shipping containers as a wind buffer facing the prevailing easterly winds. The existing logistics building is reworked with a perimeter extension around a sheltered workers’ courtyard, and the container wall holds coffee kiosks, rest areas, small workspaces and viewing platforms that open the waterfront to the public.
How the student framed the challenge
- Pedestrian wind comfort around logistics buildings
- Urban integration of port logistics waterfront
- Reuse of shipping containers as building material
Metrics and evidence
Every metric the project used, as named by the student, with the value, the calculation and the portfolio page.
| Metric | Student’s wording | Value | How it was calculated | Tool | Page |
|---|---|---|---|---|---|
| Pedestrian-level wind speed | Coastal wind conditions / reduction of pedestrian-level wind speed | typical waterfront 6.0 m/s vs proposal 3.97 m/s; text states U-shaped layout cuts wind speed by about 50% | Wind speed at about 1.5 m above ground in the sheltered zone, from CFD simulation of container layouts, compared with typical waterfront wind speed. | Eddy (Grasshopper) | 7, 11 |
| Publicly accessible area | Sheltered public space / Wind-protected public area | existing 0 m² vs proposal 1,850 m² | Area of public outdoor space protected from wind by the container buffer. | not stated | 11 |
| Material reuse share | Container reuse | existing 0 vs proposal 85 | Count of shipping containers reused as structures (one container about 5.9 x 2.35 x 2.28 m). | manual / formula | 10, 11 |
| Wind conditions | Wind rose analysis | summer scale up to about 15.4 m/s, calm 0.27% (6 h); winter scale up to about 25.2 m/s, calm 1.39% (30 h); strongest winter winds from the east | Hourly wind rose from IWEC weather data for Reykjavík, summer (Jun-Aug) vs winter (Dec-Feb). | Ladybug | 8 |
| Social interaction index | Improvement of public space usability | — | Whether outdoor areas around the building become comfortable and usable; named in questionnaire, not quantified beyond sheltered area. | not stated | questionnaire only |
| Pedestrian-level wind speed | Controlled wind flow around the building mass | — | Qualitative check of whether the form redirects or diffuses wind instead of accelerating it (e.g. softened corners instead of 90° edges). | Eddy (Grasshopper) | 7 |
| Electricity price | Electricity price | about 0.05-0.10 EUR/kWh | Approximate business electricity price in Iceland. | not stated | questionnaire only |
Tools
- Eddy3D — CFD wind simulation comparing linear, corner and U-shaped container layouts
- Grasshopper — Parametric host for the Eddy wind simulations
- Ladybug — Seasonal wind roses from IWEC weather data for Reykjavík
- Miro — Concept sketches and problem framing (questionnaire only)
Trade-offs
- Green planted area competes with usable public space; resolved by combining planting with social courtyards (questionnaire).
- The Borgartún location alternative gave better access but lost the waterfront connection and industrial identity; the waterfront site was chosen despite worse wind exposure (questionnaire).
- Public uses on the waterfront may conflict with port logistics operations and could lead to gentrification (questionnaire).
Decision
The wind simulations showed the U-shaped container layout gave the strongest shelter, so it was chosen for the container wind buffer, with corners softened below 90° to avoid speeding up the wind. The wind rose showing strong easterly winter winds set the orientation of the buffer facing the sea.
Open questions
- Cannot fully simulate or validate complex wind behaviour without a wind engineer (questionnaire C4).
- CapEx/OpEx, surface-runoff reduction, grey-water strategy and building energy demand not yet studied (questionnaire).
- Next step named by consultants: refine container height and placement with further simulation and change the logistics building layout itself.
- Biggest gaps named: research depth and KPI understanding (6.2).
Connections
- Challenges addressed: Outdoor microclimate around logistics buildings, Urban integration of logistics buildings, Embodied carbon and adaptive reuse of logistics buildings
- Metrics used: Pedestrian-level wind speed, Publicly accessible area, Material reuse share, Wind conditions, Social interaction index, Electricity price
- Tools used: Eddy3D, Grasshopper, Ladybug
Something wrong or missing? Suggest a correction