Case study · draft
A student project from the Rethinking.Logistics studio showing how tools deliver metrics for decisions.
| Student | Julia Godard Lombard |
| Project | Phantom Data Center |
| Portfolio | heyzine.com/flip-book/c6fc2ceefc.html |
| Studio | AD6 (Studio Kurilla-Prokop), bachelor thesis, summer semester 2025-26 |
| Year | 2026 |
| Location | Desfourský Palace, Na Florenci 21a, Nové Město (Florenc), Prague |
| Typology | storage data centre inserted into a listed abandoned building, combined with heat-using mixed-use programmes (sauna/wellness, dry-food production, café) |
| Status | draft |
Also known as: Julia Lombard
Project
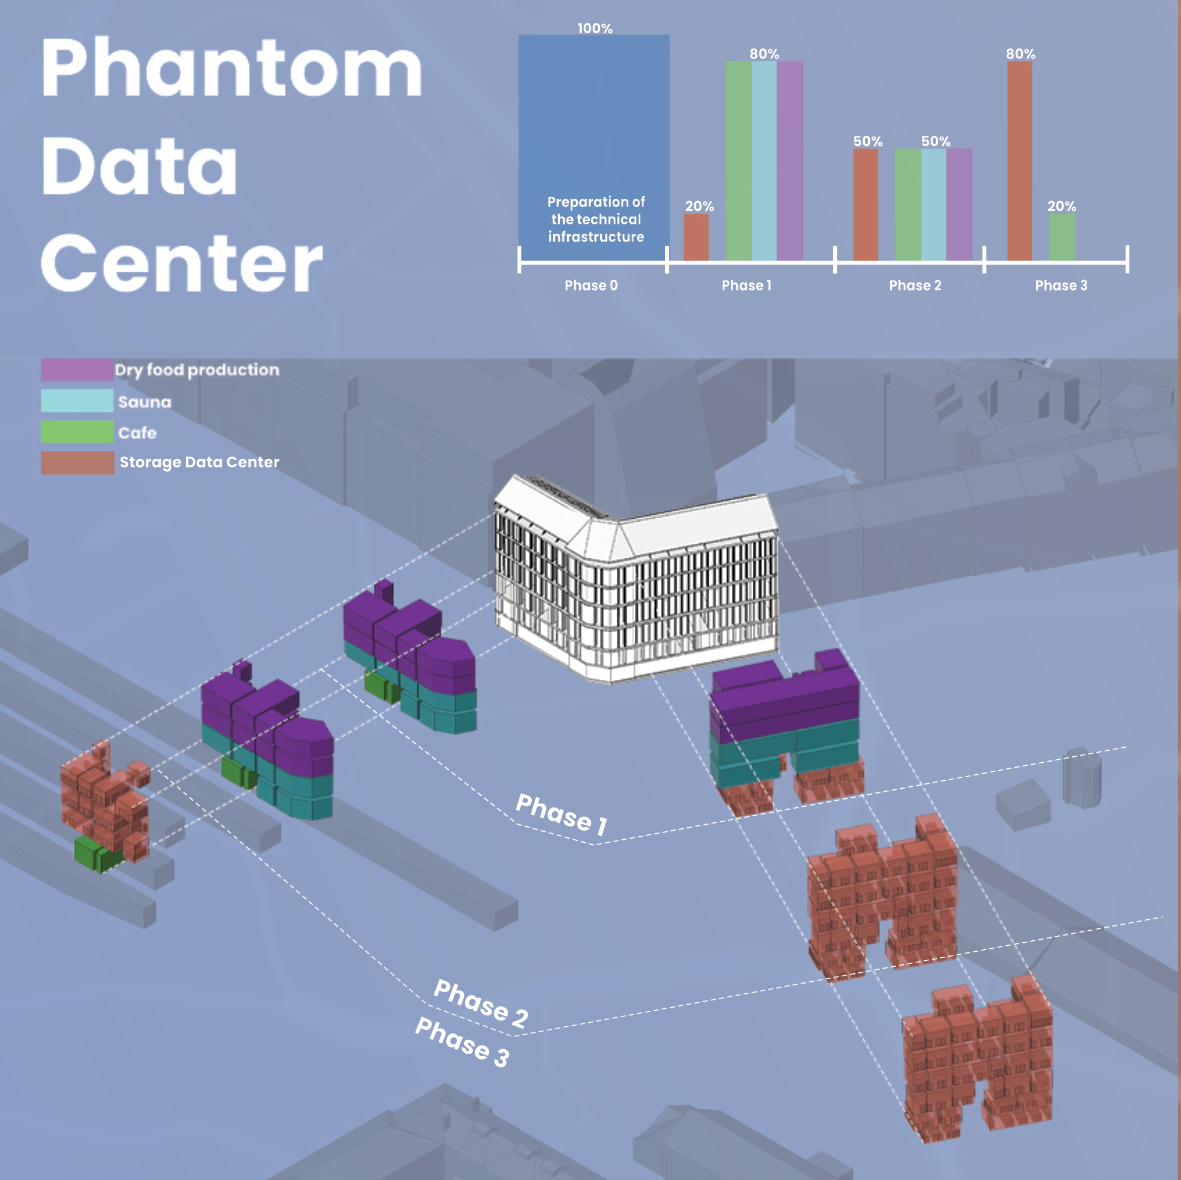
The project asks how storage data-centre capacity can grow in Prague without new construction, starting from the large stock of unused buildings (about 5.68 million m² in Prague). After mapping data-centre typologies and matching them against a matrix of listed abandoned buildings by size, the neglected 1847 Desfourský Palace near Masarykovo station was chosen. The building is prepared in a phase P0 (selective demolition, recycled-steel column-beam grid, building-wide HVAC, dry coolers in the roof) and then tested in three phases with an increasing data-centre share (20%, 50%, 80%). Heat from servers in temperature-controlled steel boxes is recovered for heat-hungry programmes chosen for their heat demand and social value, and in later phases for neighbouring buildings and the district.
How the student framed the challenge
- Heat waste from data centres
- Adaptive reuse of abandoned listed buildings
- Urban integration of digital infrastructure
- Data centre energy and cooling demand
Metrics and evidence
Every metric the project used, as named by the student, with the value, the calculation and the portfolio page.
| Metric | Student’s wording | Value | How it was calculated | Tool | Page |
|---|---|---|---|---|---|
| Waste heat recovery | Heat production | P1 4,500 kW (300 servers); P2 17,250 kW (1,150 servers); P3 table shows 4,500 kW but chart implies about 22,500 kW (1,500 servers) | Number of servers multiplied by an assumed heat output per server/rack (values match 15 kW per unit). | manual / formula | 33, 40, 47, 53 |
| Waste heat recovery | Heat recoverable | P1 31,536; P2 120,888; P3 about 157,000 (read from chart) | Heat production times 8,760 h times about 80% recovery efficiency (inferred from the numbers). | manual / formula | 33, 40, 47 |
| Waste heat recovery | Heat needed | P1 2,627.95 MWh; P2 2,323.35 MWh; P3 table shows 4,500 kW (placeholder) | Annual heat demand of the café, sauna/wellness and dry-food production in each phase, built up from per-programme kW ranges. | manual / formula | 33, 40, 47 |
| Heat recovery radius | Heating recovery (kW/m) / heating recovery radius | P1 225 m; P2 430 m; P3 500 m | Area around the building that surplus recovered heat could serve, drawn as a radius on the city map. | not stated | 35, 42, 49 |
| — | Amount of servers | P1 300; P2 1,150; P3 1,500 | Count of server racks placed in the temperature-controlled boxes per phase. | manual / formula | 29, 37, 44, 53 |
| Mixed-use ratio | Storage data center / mixed-use programmes area | Data centre P1 1,565 / P2 16,703 / P3 17,568 m²; dry food P1 5,293 / P2 4,925 / P3 0 m²; sauna P1 4,760 / P2 3,789 / P3 0 m²; café 587 m² in all phases | Floor area given to each programme in each phase. | not stated | 29, 37, 44 |
| Power usage effectiveness | Energy consumption | programme ranges: sauna 40-120 kW, café 20-60 kW, dry food 60-150 kW; data-centre values shown only as relative bars | Energy used by the data centre compared with other energy sources; per-programme ranges taken from literature. | not stated | 14, 15, 33, 40, 47 |
| Water consumption | Water consumption | programme ranges: sauna 500-1,500, café 200-600, dry food 200-800 m³; data centre shown only as relative bars | Volume of water used by the data centre and programmes; programme ranges from literature. | not stated | 14, 15, 33, 40, 47 |
| Adaptability | Scalability / Flexibility-Adaptability | rack volumes 0.26 m³ (12U) to 1.54 m³ (48U); programme volumes sauna 2,000-6,000, café 1,000-3,000, dry food 3,000-7,000 m³ | Volume range of racks and therefore of the data-centre structure; per programme also the volume range needed. | not stated | 8, 14, 15 |
| Jobs created | Social impact / Community & social impact | sauna 20-40, café 10-20, dry food about 50 jobs | Number of jobs created by each programme. | not stated | 14, 15, 33 |
| — | Power density | low 2-5, medium 5-15, high 15-30, extreme over 50 kW/rack | Industry ranges per rack size used to size heat and cooling. | not stated | 6, 8 |
| Operational carbon | Carbon emission | — | Carbon emissions depending on sector; shown only as a relative bar. | not stated | 15 |
| Land take | Land use | — | Ratio between building footprint and green-blue spaces; shown only as a relative bar. | not stated | 15 |
| Delivery catchment | Transport | — | Distance and accessibility for goods and users; shown only as a relative bar. | not stated | 15 |
| Green area ratio | Biodiversity | — | Area of green-blue space accessible to people, animals and insects; shown only as a relative bar. | not stated | 15 |
| Worker well-being | Health & Wellbeing | — | Index combining pollution, safety and stress; shown only as a relative bar. | not stated | 15 |
| Electricity price | Electricity price | 1.451 CZK/kWh | Business electricity tariff in Prague. | not stated | questionnaire only |
Tools
- Geoportal Praha — Utility network base map (electricity, communication, gas, sewage) around the site
- prazdnedomy.cz database — Inventory and floor areas of listed abandoned buildings for the typology/size matrix
- Ladybug (probable — inferred from the graphics, not named) — Wind rose / sun-path overlay on the site plan
Trade-offs
- Raising the data-centre share increases heat production, recoverable heat and heat-recovery radius, but lowers the jobs created (social impact) as sauna and dry-food production are removed by P3.
- More servers raise recoverable heat but also raise energy consumption and water consumption, which grow with the data-centre share.
- Maximising solar panels improves energy supply but adds structural load and lowers biodiversity net gain (questionnaire).
Decision
The heat balance showed that even the small P1 data centre produces far more recoverable heat than the café, sauna and dry-food programmes need, which supported choosing heat-hungry programmes and planning to export surplus heat to neighbours and the district in later phases. The phased approach (P1 to P3) and a building-wide HVAC installed in P0 were chosen so the data-centre share can grow without new structural work.
Open questions
- Not sure how to calculate how much renewable energy can be produced on site (questionnaire 1.3).
- CapEx/OpEx ratio, surface-runoff reduction, BNG approach and native species not yet known (questionnaire).
- Carbon, land use, transport, biodiversity and health KPIs appear only as unlabelled relative bars without numbers.
- Biggest gap named: KPI understanding and the evidence base (6.2).
Connections
- Challenges addressed: Waste heat and cooling of data centres, Embodied carbon and adaptive reuse of logistics buildings, Urban integration of logistics buildings
- Metrics used: Waste heat recovery, Heat recovery radius, Mixed-use ratio, Power usage effectiveness, Water consumption, Adaptability, Jobs created, Operational carbon, Land take, Delivery catchment, Green area ratio, Worker well-being, Electricity price, Function stacking index
- Tools used: Geoportal Praha
Something wrong or missing? Suggest a correction