Case study · verified
A student project from the Rethinking.Logistics studio showing how tools deliver metrics for decisions.
| Student | Roshni Basu |
| Project | The Urban PlugIn |
| Portfolio | heyzine.com/flip-book/c8d3453076.html |
| Studio | Kurilla-Prokop |
| Year | 2026 |
| Location | Prague, Czech Republic – city-wide network of 12 microhubs; design integration shown at Jan Palach Square (compact historic centre) and in a panelák housing estate |
| Typology | urban micro-hub / dark-store network (modular last-mile pavilions) |
| Status | verified |
Project
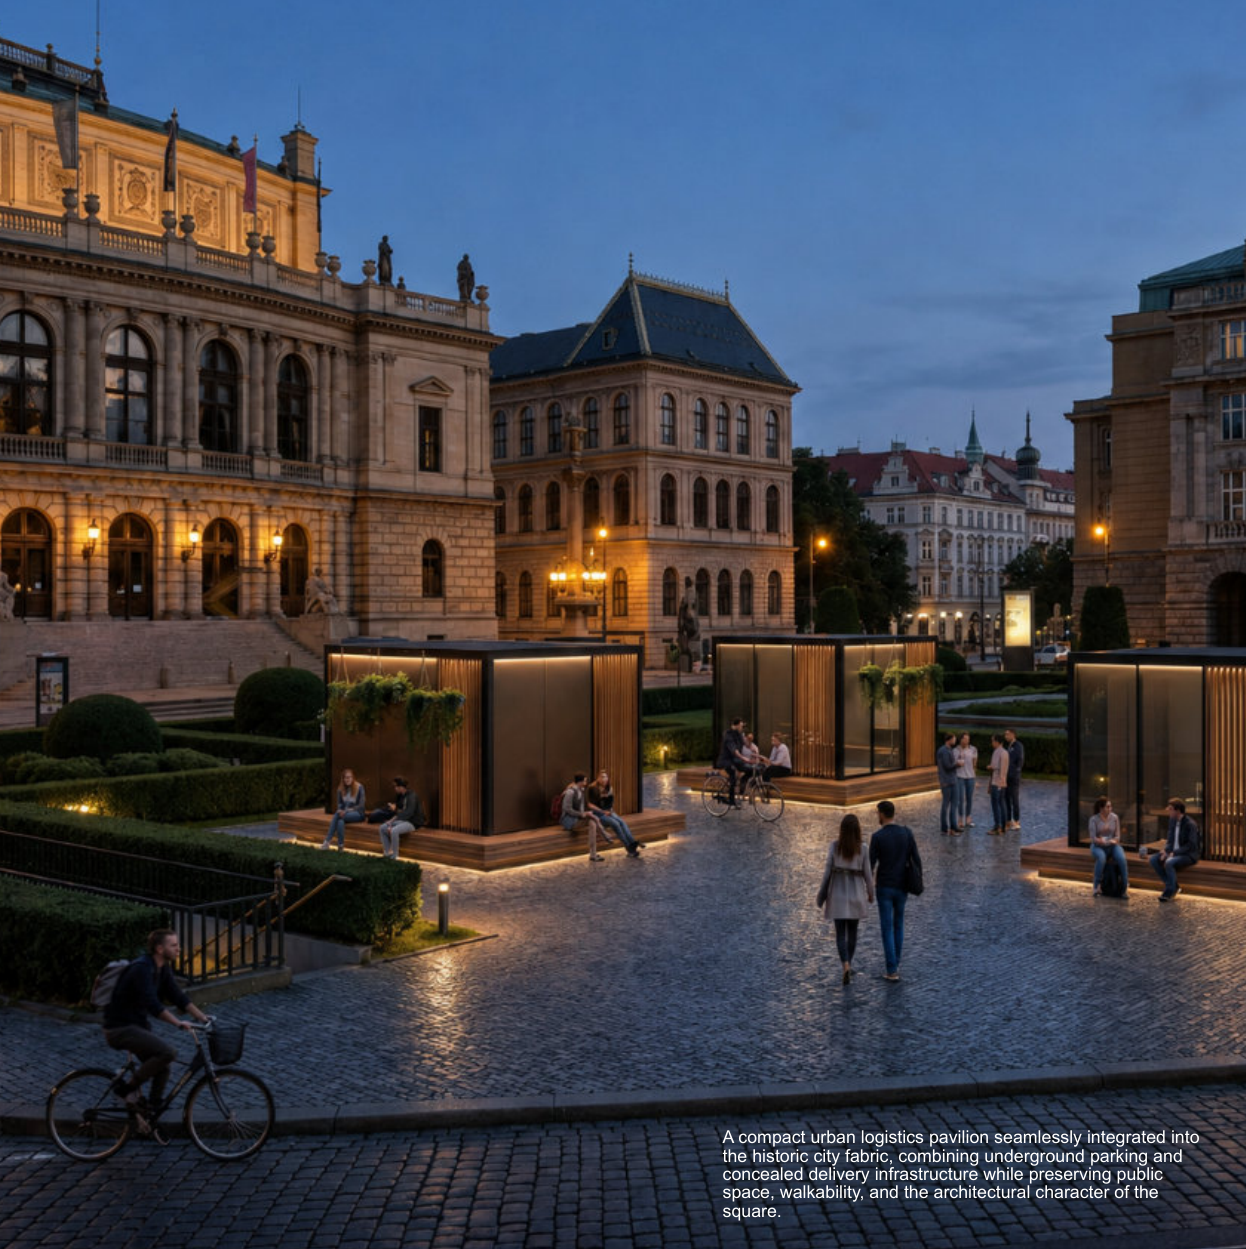
The project starts from Prague’s e-commerce logistics, where large fulfilment centres on the city edge feed fragmented, duplicated last-mile routes and a growing number of parcel lockers. Using India’s Blinkit quick-commerce ‘dark store’ model as reference, it proposes a decentralised network of twelve neighbourhood microhubs, each serving a radius of about 2–3 km, sited by population density. A modular ‘Urban Logistic PlugIn’ unit (storage box with pickup counter, stackable and joinable, with solar roof, planter, bench and wiring) is adapted to two housing typologies: in the compact historic centre it is a small pavilion cluster linked to underground parking/delivery levels, and in panelák estates it becomes a market-and-hub cluster that activates underused open space. Urban, greenery and energy KPIs are proposed to measure social use, green space and solar contribution before and after.
How the student framed the challenge
- Fragmented last-mile delivery in dense cities
- Urban integration of logistics micro-hubs
- Activation of underused residential open space
- Parcel locker clutter in public space
Metrics and evidence
Every metric the project used, as named by the student, with the value, the calculation and the portfolio page.
| Metric | Student’s wording | Value | How it was calculated | Tool | Page |
|---|---|---|---|---|---|
| Social interaction index | Social Interaction Index – users/day in courtyard | Shown only as an unlabelled before/after bar; no numbers | Count of people using the courtyard/open space per day, before vs after intervention. | not stated | 17 |
| Social interaction index | Public Safety Activation – % increase in active public space | Shown only as an unlabelled bar; no numbers | Percentage increase in actively used public space as a proxy for perceived safety through visibility and activity. | not stated | 17 |
| Green area ratio | Green Space Preservation – % courtyard maintained as green | Shown only as an unlabelled bar; no numbers | Green area remaining after inserting hub units divided by total courtyard area. | not stated | 18 |
| Social interaction index | Green Space Activation – users/day using green area | Shown only as an unlabelled bar; no numbers | Count of daily users of the green area. | not stated | 18 |
| On-site renewable energy share | Renewable Energy Contribution – % hub energy from solar | Questionnaire estimate: courtyard concept 20–40%, panelák concept 40–70%; portfolio bar unlabelled | Annual PV generation on hub roofs divided by hub energy demand (lighting, small storage, refrigeration, vehicle charging). | not stated | 19; questionnaire Economy 3 |
| Rooftop PV generation | Energy Shared with Residences – kWh/year exported | Questionnaire estimate: 10–30% of generated energy could be shared; no kWh figure given | Surplus PV generation exported to neighbouring residential buildings per year. | not stated | 19; questionnaire Economy 3 |
| Delivery catchment | Dark store placement logic – R = 2.5 km, 10–15 mins | Radius 2.5 km (text: 2–3 km); delivery 10–15 min on diagram, ~5 min in caption | Circular service area around each dark store giving a delivery-time estimate; adapted from Blinkit’s 2–4 km dark-store radius. | manual / formula | 6, 8, 9 |
| Delivery catchment | Twelve strategically located microhubs | 12 microhubs with overlapping coverage | Number of hubs needed so that 2–3 km service circles overlap to cover the metropolitan area. | manual / formula (map overlay) | 8 |
| Delivery catchment | Population or demand density map | Map classes 63–715 up to 5,971–11,817 inhabitants/km² | District population density used to identify optimal dark-store locations by demand intensity. | not stated (external density map) | 9 |
| — | Prevailing type of housing | Compact urban 10%; housing estates 35% (after 1970) and 10% (till 1970) | Share of Prague city parts by prevailing housing type, used to select the two design typologies. | not stated (external housing-type map) | 10, 11, 12 |
| Jobs created | Local Economic Activation | — | Local jobs, services or micro-economies generated by the hub (e.g. market stalls, repair). | not stated | questionnaire 3.2 |
Tools
No digital tool is named in the portfolio — values were estimated by hand, taken from literature, or not quantified.
Trade-offs
- Social and ecological activation of courtyards (social interaction, green space activation) conflicts with logistics presence, which brings noise, visual impact and perceived intrusion; mitigated by keeping units compact and partly underground (questionnaire).
- The courtyard/historic-centre concept gives deeper integration and social value but higher embodied carbon and CapEx because of underground construction, while the panelák concept is cheaper and has higher solar share (40–70% vs 20–40%) (questionnaire).
- Green space preservation (% kept green) competes with the footprint of inserted hub units and market functions.
Decision
Population density and service-radius analysis led to a network of twelve neighbourhood microhubs instead of more parcel lockers; the housing-typology study led to two variants of one modular unit, hidden with underground delivery access in the compact centre and used as a market-and-greenery cluster in panelák estates.
Open questions
- KPI pages show only unlabelled before/after bars; no baseline or proposal values are given for any of the six KPIs.
- Energy figures (solar share, energy shared) appear only as estimates in the questionnaire, with no calculation method shown.
- The student reported no open gaps; planned next steps were to classify courtyard typologies and strengthen KPIs for energy, user benefit and logistics efficiency (questionnaire 1.5).
Connections
- Challenges addressed: Last-mile delivery emissions and traffic, Urban integration of logistics buildings, Public access and community use of logistics sites
- Metrics used: Social interaction index, Green area ratio, On-site renewable energy share, Rooftop PV generation, Delivery catchment, Jobs created
- Tools used: Grasshopper
Something wrong or missing? Suggest a correction