Case study · verified
A student project from the Rethinking.Logistics studio showing how tools deliver metrics for decisions.
| Student | Adam Večeřa |
| Project | Regenerative.Logistics – Consumer-integrated storage and distribution warehouse, IKEA Černý Most, Praha 14 |
| Portfolio | heyzine.com/flip-book/6cdeb96148.html |
| Studio | Kurilla – Prokop atelier (ARCHIP, summer semester 2025–26); AD level not stated |
| Year | 2026 |
| Location | IKEA Černý Most, Chlumecká 664/10, Praha 14, Prague, Czech Republic – between Černý Most housing, the D10 highway and the Rokytka valley |
| Typology | consumer-integrated storage + retail showroom (vertical mixed-use logistics tower with automated high-bay storage) |
| Status | verified |
Project
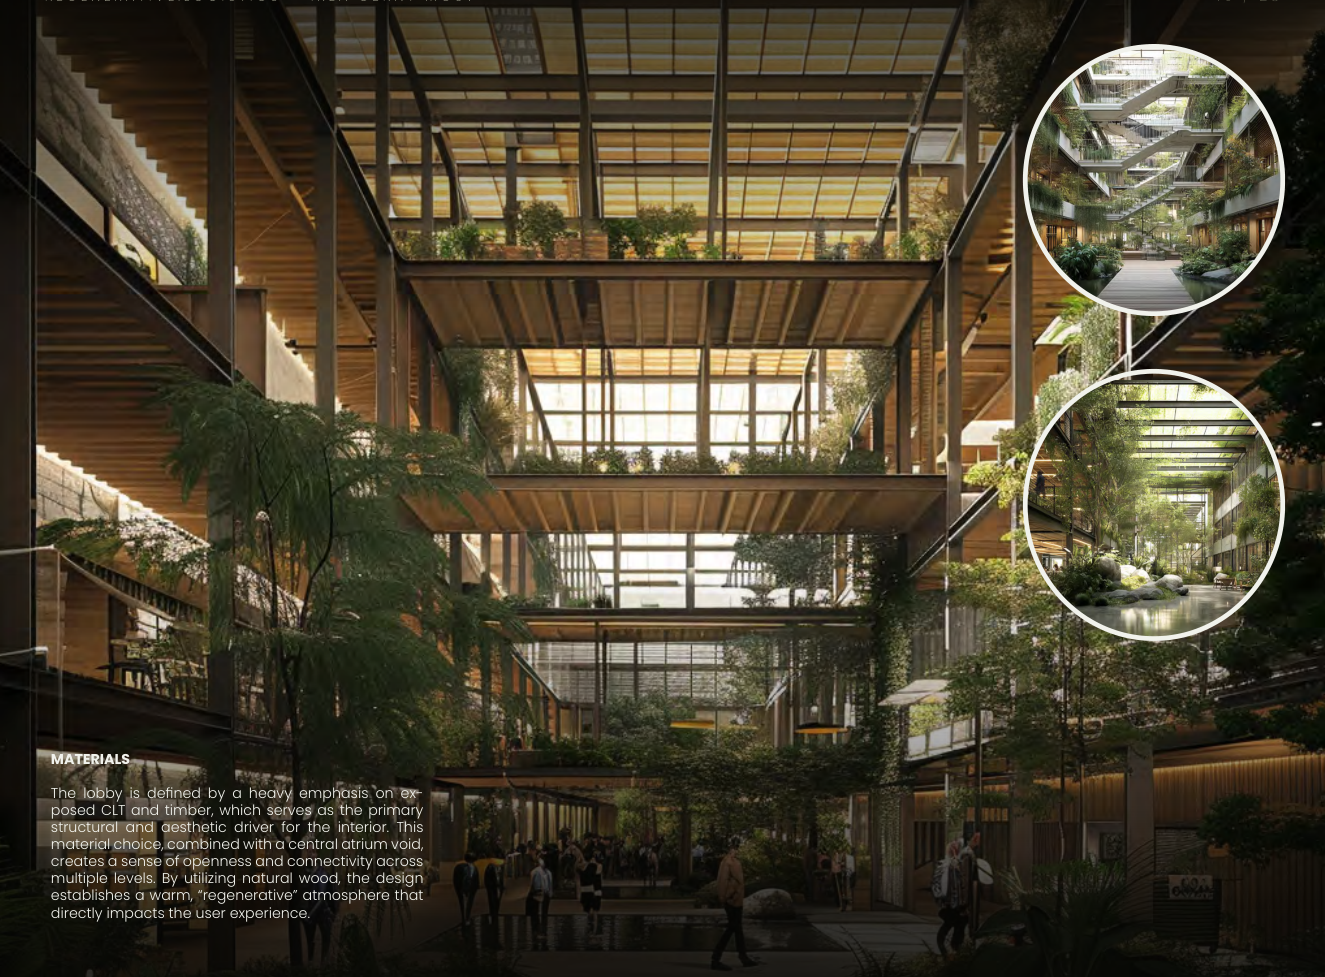
The project replaces the horizontal, car-dependent IKEA Černý Most store (about 400×400 m, surface parking, ~90% sealed) with a ~65 m vertical tower that stacks underground parking (1,200 spaces), an 84,000 m² automated high-bay store, a public lobby and park, restaurant, 7,500 m² market hall, showroom floors, planning studios and a green roof with PV. Stacking frees around 120,000 m² of ground for a public park with a pond and an east–west ecological corridor that crosses the D10 via bio-bridges to the Rokytka valley. The building is generated by a three-module parametric Grasshopper/Rhino system intended to adapt to other sites, and the business model merges storage, retail, public space and last-mile into one building at a metro node. A framework of 30 KPIs in six categories (ecology, energy, water, urban, indoor, materials) sets targets against existing site values and benchmarks.
How the student framed the challenge
- Land take of horizontal retail warehouses
- Ecological connectivity across highway barriers
- Sealed surfaces and stormwater on retail sites
- Car-dependent access to logistics retail
Metrics and evidence
Every metric the project used, as named by the student, with the value, the calculation and the portfolio page.
| Metric | Student’s wording | Value | How it was calculated | Tool | Page |
|---|---|---|---|---|---|
| Biodiversity net gain | KPI 1.1 Biodiversity net gain | Existing: low → green roof +24%, ground level +35%; target +35% net gain | Percentage change in biodiversity units of the proposal versus the existing site baseline, split into green roof and ground-level contributions. | not stated | 6, 12, 20, 22, 26 |
| Native species richness | KPI 1.2 Habitat units | 1 (degraded surface) → 6 (green roof, meadow, riparian, woodland edge, bat/bird walls, water feature) | Count of distinct habitat types present on site. | manual / formula | 12, 21 |
| Tree count and canopy cover | KPI 1.3 Tree canopy coverage | Current 5% → ground trees 28% + roof/terraces 34% = 62% | Canopy area (ground trees + roof/terrace trees) divided by site footprint. | not stated | 12, 20, 22 |
| Green space per visitor | KPI 1.4 Green space per capita | Current IKEA 0.3 m² → proposed 8.4 m² (EU standard 9 m²) | Accessible green area divided by number of daily visitors, compared to an ‘EU standard’ of 9 m². | manual / formula | 12 |
| Ecological connectivity | KPI 1.5 Ecological connectivity (E–W corridor) | Current disconnected (IKEA barrier) → proposed E–W corridor: residential – green lobby – bio-bridges – D10 underpass – Rokytka | Whether a continuous green link exists from residential Černý Most through the site to the Rokytka valley. | manual / formula | 12, 19, 26 |
| Native species richness | Biodiversity baseline – target 24+ native species | Existing: 5 ruderal species listed in neglected margins → target 24+ native species | Species survey of existing site margins vs proposed planting list. | not stated (site survey) | 11 |
| Energy use intensity | KPI 2.1 EUI | Typical IKEA ~320, EU benchmark ~170, NZEB ~110 → target 85 kWh/m²·yr | Total annual energy consumption divided by floor area. | not stated | 6, 13 |
| Operational carbon | KPI 2.2 Operational carbon | Typical retail ~65, with heat pumps ~30, + renewables ~15 → target ≤10 kgCO2e/m²·yr | Annual emissions from heating, cooling and lighting per floor area. | not stated | 6, 13 |
| Embodied carbon intensity | KPI 2.3 Embodied carbon | Target ≤350 kgCO2e/m²; no calculated value shown | Embodied carbon per m² for product stages A1–A3; strategies listed (reuse existing slab and structure, timber hybrid CLT/glulam, reduced structure, avoiding deep foundations). | not stated | 6, 13 |
| On-site renewable energy share | KPI 2.4 Renewable energy share | Current IKEA ~8% → target ≥90% | On-site renewable generation divided by total demand; mix 70% roof PV, 20% wind, 10% other. | not stated | 6, 13, 22 |
| — | KPI 2.5 Building airtightness q50 | Typical warehouse ~10.0, current IKEA est. ~6.0, passive standard ≤0.6 → target ≤1.0 | Air leakage rate at 50 Pa per envelope area. | not stated | 6, 13 |
| Water reuse share | KPI 3.1 Water consumption & reuse | Target 60% (headline only) | Share of water demand met by recycled rainwater and greywater in a closed loop (rainwater → filtration → WC flush → greywater → reuse). | not stated | 6, 14 |
| Stormwater retention volume | KPI 3.2 Rainwater retention | Current ~30 m³ → green roof 320 m³ + cistern 480 m³ = 800 m³ | Sum of storage volumes retaining rainwater on site before drainage (green roof buffer + underground cistern). | manual / formula | 6, 14, 22 |
| Impervious surface ratio | KPI 3.3 Permeable surface ratio | Before 90% sealed (10% permeable) → porous paving 18% + green roof 24% + ground planting 18% = ≥60% | Permeable area (porous paving + green roof + ground planting) divided by site area. | manual / formula | 6, 11, 14 |
| Stormwater runoff reduction | KPI 3.4 Stormwater infiltration | Target ≥50% peak flow reduction | Reduction of peak runoff through bioswales, rain gardens and green-roof delay (substrate holding 40–60 mm). | not stated | 6, 14 |
| Urban heat island effect | KPI 3.5 Urban heat island reduction | Dark tarmac current +8°C, cool paving +4°C, green coverage +2°C → target ≤+3°C (UHI −3°C headline); microclimate −5°C daytime peak | Surface temperature excess over reference for different surface treatments (dark tarmac, cool paving, green coverage). | not stated | 6, 11, 14 |
| Walkability | KPI 4.1 Walk score | Current 18/100, Prague avg 55/100 → target 75/100 | Walk score of the site (quality of pedestrian environment). | not stated | 6, 10, 15 |
| Public transport accessibility | KPI 4.2 Distance to transit | Metro B 1 km, bus stop 120 m → proposed covered link 280 m, 5 min from metro | Walking distance/time from building entrance to nearest stops. | not stated | 6, 10, 15 |
| Public transport accessibility | KPI 4.3 Cycling infrastructure | 300 bike spaces; bike access score 4/10 → 8/10 | Count of secure bike spaces plus facilities (A26 link 300 m to Rokytka path, showers, shared bikes). | manual / formula | 6, 10, 15, 26 |
| Public transport accessibility | Site analysis – accessibility | Car 9/10; bike 4→8/10; transit 7/10; walk 3→7/10 | Qualitative scoring of car, bike, transit and walk access before and after intervention. | manual / formula | 10 |
| Mixed-use ratio | KPI 4.4 Mixed-use ratio | Current 1 use → 6 uses (storage 35%, retail 22%, showrooms 18%, then 12%, 8% and remainder) | Count of distinct program functions and their share of floor area. | manual / formula | 6, 15 |
| Publicly accessible area | KPI 4.5 Public space coverage | Current ~3% → ground park 18% + roof terraces 12% + lobby/passages 15% = 45% | Publicly accessible area (ground park + roof terraces + lobby/passages) divided by site area. | manual / formula | 6, 15 |
| Daylight autonomy | KPI 5.1 Daylight autonomy DA300 | Current IKEA ~10%, atrium void 45%, glazed facades 60% → target ≥65% | Share of occupied hours reaching 300 lux from daylight alone. | not stated | 6, 16, 21, 24 |
| Indoor air quality | KPI 5.2 Indoor CO₂ | Outdoor 420, typical retail 1,200, WELL 900 → target ≤800 ppm | Indoor CO2 level as ventilation/air quality indicator. | not stated | 6, 16, 21 |
| Thermal comfort | KPI 5.3 Thermal comfort | Target ≥90% satisfied | Share of occupants within comfort zone, PMV between −0.5 and +0.5. | not stated | 6, 16 |
| Noise level | KPI 5.4 Acoustic comfort | Logistics ≤65 dB(A); retail ≤50 dB(A), RT ≤0.8 s; studios ≤40 dB(A), RT ≤0.5 s; restaurant ≤45 dB(A) | Zone-specific background noise and reverberation targets. | not stated | 6, 16 |
| Worker well-being | KPI 5.5 People flow + satisfaction | Target ≥80% | Annual post-occupancy survey covering comfort, air, light and noise. | not stated (proposed POE survey) | 6, 16, 21 |
| Material reuse share | KPI 6.1 Materials hierarchy (Materialepyramiden) | Existing (reused) 40%, timber 30%, steel 20%, other 10% | Material selection ranked by reuse > upcycle > recycle > recover > landfill; resulting mix by share. | Materialepyramiden (reference) | 6, 17 |
| Material reuse share | KPI 6.2 Recycled material content | Typical construction ~12% → reclaimed steel 90%, reclaimed timber 80%, insulation 60%; weighted avg ≥50% | Volume-weighted average of recycled/reclaimed content across materials. | manual / formula | 6, 17 |
| Material reuse share | KPI 6.3 Construction waste diversion | Target ≥90% | Construction waste diverted from landfill via pre-demolition audit, on-site sorting and structure retention, tracked by waste manifest. | not stated | 6, 17 |
| Material reuse share | KPI 6.4 Material reuse rate | Foundation slab 95%, column grid 80%, facade 20%, roof structure 30%; weighted avg ~40% | Weighted average of retained shares per element. | manual / formula | 6, 17 |
| CapEx–OpEx ratio | KPI 6.5 Life-cycle cost | Conventional CapEx 40% / OpEx 40%; regenerative CapEx 50% / OpEx 20% (+30% other); OpEx saving −60%; payback 12 years | 30-year total cost (capital + operational + maintenance) compared between conventional and regenerative scenarios. | not stated | 6, 17 |
| Land take | Horizontal → vertical: ~120,000 m² freed | ~120,000 m² freed for public park and ecology | Difference between existing horizontal footprint (~400×400 m) and vertical tower footprint. | Grasshopper / Rhino (parametric model) | 7, 19 |
Tools
- Grasshopper — Parametric system of three modules (underground parking, high-bay automated storage, mixed-use public floors) generating the building configuration and area allocation for any site
- MidJourney — AI visualisations (exterior, lobby, rooftop, market hall, ecological bridge)
Trade-offs
- Adding green facades and roof (green roof/wall coverage, biodiversity) increases structural weight and therefore initial cost (CapEx) and may affect building operation (questionnaire).
- Higher CapEx share (50% vs 40%) is accepted to reduce OpEx by 60% over 30 years, with a 12-year payback (life-cycle cost KPI).
- Going vertical frees ~120,000 m² of ground for park and ecology but requires deep underground storage and parking (−24 m), which conflicts with the embodied-carbon strategy ‘no underground / avoid deep foundations’ listed under KPI 2.3.
Decision
The KPI targets (permeable ≥60%, public space 45%, tree canopy 62%, ecological corridor E–W) supported stacking the IKEA program vertically to free ground for a public park, pond and an east–west ecological corridor with bio-bridges over the D10, while retaining the existing slab and column grid and using a CLT/glulam timber hybrid.
Open questions
- Almost all KPI values are targets or benchmark comparisons; no simulation or calculation tool is shown for energy, daylight, LCA, BNG or stormwater.
- Student reported missing technical depth on solutions and materials, and on how the building functions after the change of shape (questionnaire 1.3).
- Research depth named as biggest gap (questionnaire 6.2); species/animal analysis not developed in depth.
- No alternative concept representing the opposite end of the green-weight vs cost trade-off was developed.
Connections
- Challenges addressed: Land take of logistics buildings, Biodiversity and ecological connectivity on logistics sites, Stormwater and sealed surfaces on logistics sites, Urban integration of logistics buildings
- Metrics used: Biodiversity net gain, Native species richness, Tree count and canopy cover, Green space per visitor, Ecological connectivity, Energy use intensity, Operational carbon, Embodied carbon intensity, On-site renewable energy share, Water reuse share, Stormwater retention volume, Impervious surface ratio, Stormwater runoff reduction, Urban heat island effect, Walkability, Public transport accessibility, Mixed-use ratio, Publicly accessible area, Daylight autonomy, Indoor air quality, Thermal comfort, Noise level, Worker well-being, Material reuse share, CapEx–OpEx ratio, Land take, Function stacking index, Green-core anchoring of mixed uses
- Tools used: Grasshopper
Something wrong or missing? Suggest a correction